Frontier models are the engine. We build the vehicle.

Eight industries. One factory. Production agents tuned to the physics of your business — margin, availability, SLA, working capital — deployed on your stack, governed by design

Executive Data Infrastructure as a Service

Most enterprise leadership teams are running on fragmented truth. The finance team is pulling numbers from one system, sales team from another, and the operations team from a
third, each having different definitions, different refresh rates, and different owners. The
result is endless reconciliation meetings, delayed decisions, and zero confidence in board-level reporting. The data exists but the insight and value from it is lost in the fine print.
Book a call
Dashboard interface from vdd.ai showing an overview dated 07 Aug 2026 at 22:00 UTC with metrics: 12 sources unified, 56 hours governed metrics, 340 uptime with 18% increase, 6 lineage coverage. A line chart titled Metric consistency across systems compares Systems A, B, and C over six periods with an 'Aligned' label at Period 5. A donut chart shows source contribution of 12 systems divided into product 36%, financial 34%, commercial/product/financial 18%, and commercial 12%. Region Scores bar chart highlights Middle East, Europe, Asia, America, Oceania, and Africa with scores, Asia highest near 100. Governed metrics by domain lists Revenue recognition at 98% coverage, Inventory position 96%, Customer master 94%, Service events 91%. Navigation menu on left with Overview highlighted.

We build a governed, executive-grade semantic layer deployed directly on your existing cloud infrastructure - Snowflake, Databricks, Azure, AWS or GCP. There are no forced migrations, and no ripping out what works. We connect to every source system (Oracle, SAP, Salesforce,NetSuite, custom ERPs), unify entity definitions (what is a 'customer', a 'product', a 'region'),apply lineage and quality controls, and deliver a single source of truth that executives can trust and auditors can verify. We map influence, narrative, and relationships across the open web at internet scale.

The result? We don’t just deliver a dashboard. We give you a governed semantic foundation that powers both analytics and AI agents, so every metric means the same thing, everywhere, always.
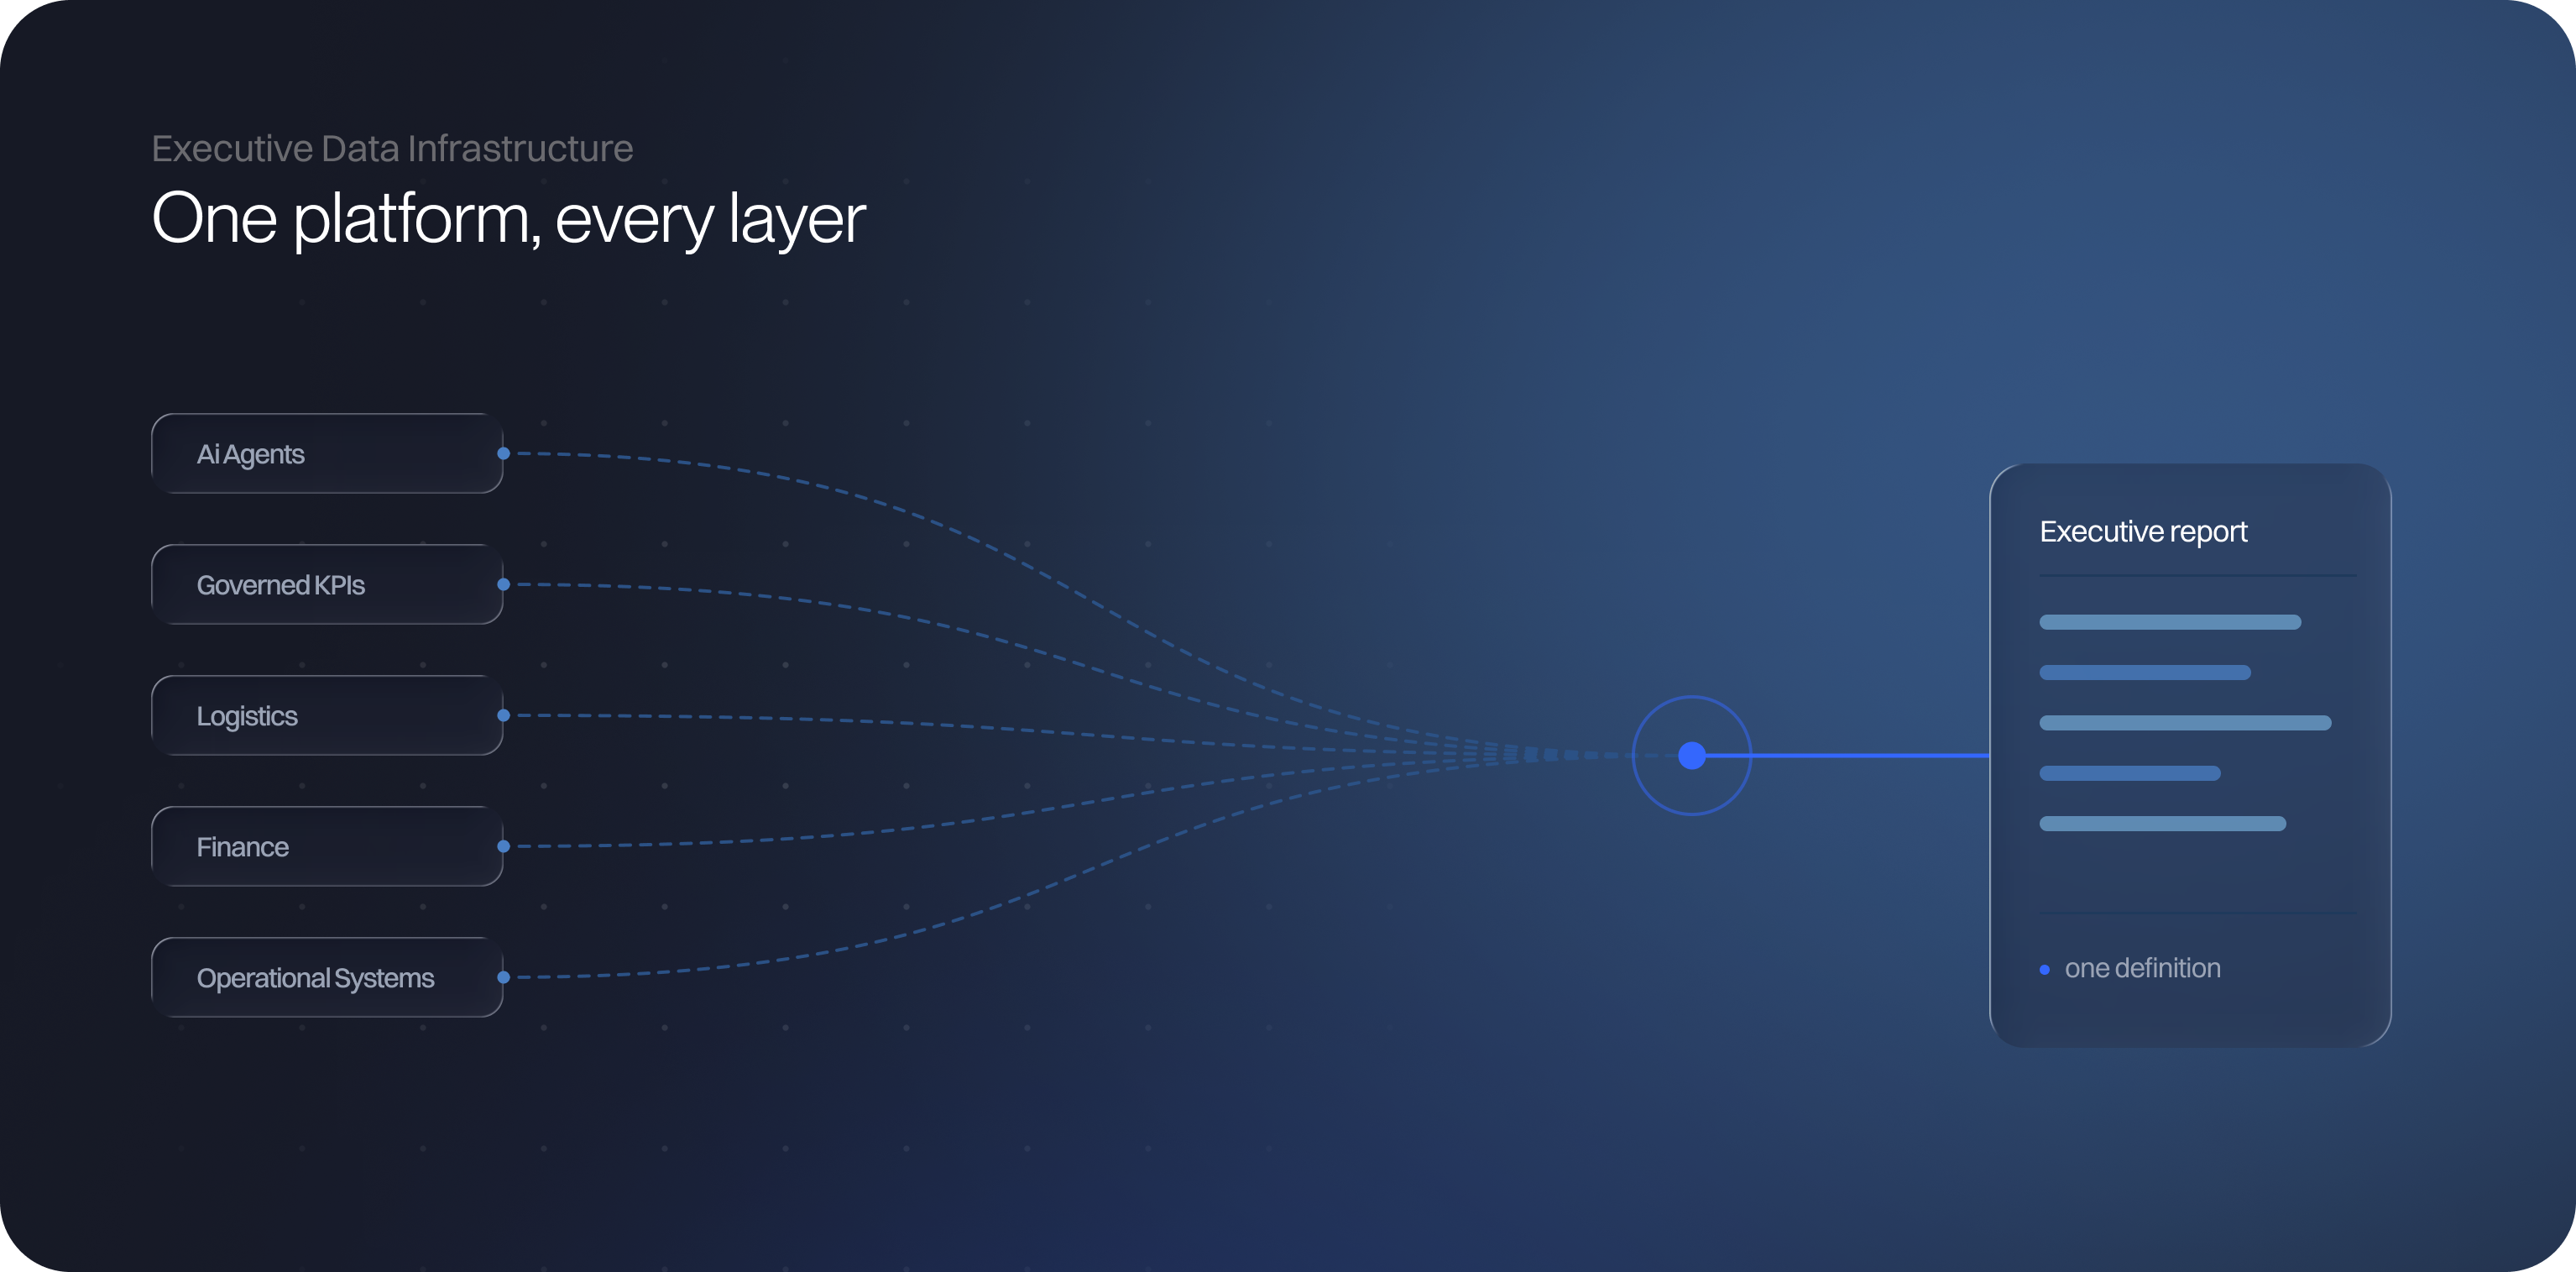
Diagram titled 'One platform, every layer' showing five data sources—AI Agents, Governed KPIs, Logistics, Finance, and Operational Systems—converging into a single Executive report with the note 'one definition.'
Capabilities
Semantic layer deployed on Snowflake / Databricks / Azure / GCP / AWS
Connectors to Oracle, SAP, Salesforce, NetSuite, custom ERPs, and finance systems
Entity resolution across products, customers, locations, and suppliers
Role-based access control (RBAC), data lineage, and full audit trail
Board-ready KPI dashboards with consistent, governed definitions
Foundation layer that plugs directly into vdd.ai AI agents

Results

Diagram titled 'Every source, one report' showing data sources ERP, CRM, POS, Finance, and Field ops feeding into a single executive report with one definition, leading to 340 governed metrics across 12 systems represented by a live source bar chart.
Consistent KPIs across business units and geographies
Blue shaded area graph with multiple peaks and smooth curves, overlaid on a grid of white dots on a dark background, illustrating fluctuating data trends.
Audit-ready reporting from day one
3D illustration of a layered platform with three blue rectangular panels stacked above a larger dark blue base, symbolizing data layers or technology stacks.
Reduced data team overhead spent on reconciliation

Isometric illustration of a blue microchip with layered square components and connecting lines on a black background.
WHo its for
CFOs, CIOs, and CDOs at enterprises running fragmented operational systems (3+ sourcesystems, 2+ cloud environments, or inconsistent reporting across regions). Industries: Retail, Finance, Automotive, Telco, Hospitality, Real Estate.
Book a call

Deep Social Graph Insights

The internet is a live signal. It’s constantly changing and evolving but enterprise teams can't read it on a scale and miss relationship networks until it's too late. Investment researchers manually track narratives across thousands of sources. Risk teams find out about reputational exposure after it surfaces in the press. There is a gap between intelligence and the infrastructure to capture, map, and act on it.
Book a call
Social Graph purpose-built agents for customer profiles in four categories: Scam & Fraud Detection detects coordinated scams and fraud activity; Market Manipulation Monitoring detects narratives affecting investor sentiment; Geopolitical Risk Intelligence monitors global events shaping financial risk; Brand & Reputation Threats surfaces narratives affecting trust and brand. Each includes specific functions like cross-platform data, influence mapping, network analysis, coordination detection, and stance analysis.

We map influence, narrative, and relationships across the open web at internet scale. Our Deep Social Graph links people, companies, topics, and events whilst surfacing connections, narrative trajectories, and risk signals that can't be seen from any single source. On top of media monitoring, we present structured relationship intelligence, deployed as a governed, query-able data product on your stack.

For investment teams, this means dealing sourcing signals before relationships are public. For strategy teams, this means competitive narrative mapping in real time. For risk teams, it means early warning on reputational exposure, executive relationships, and market sentiment shifts.

User interface showing a new narrative cluster about coordinated activity across three platforms, with nodes connected by lines on a graph, and updates on influence path, coverage, and guardrail status.
Capabilities
Internet-scale entity graph linking people, companies, topics, and events
Narrative tracking (how a topic or entity is being framed, and how that changes)
Relationship mapping for due diligence and deal sourcing
Competitive intelligence (how competitors are positioning and who is talking about them)
Risk signal monitoring (reputational exposure, regulatory narrative, leadership changes)
Delivered as a governed data product on Snowflake / Databricks / Azure / GCP / AWS

Results

Real-time competitive narrative monitoring
Isometric blue-toned illustration of a translucent vertical screen displaying a curved line graph with data points, mounted on a rectangular base with two cylindrical knobs.
Proactive narrative risk management (known before it reaches the press)
Abstract digital illustration showing overlapping elements including a dark window with a smooth graph line, a translucent panel with a wavy blue line, and a smaller square with lines suggesting text, against a blue background.
Earlier deal sourcing signals, surface opportunities before they're snagged by competitors
Isometric illustration of a transparent cube containing several blue 3D bar shapes of varying heights on a blue platform.
Richer due diligence about relationship networks, narrative history, key influences
3D bar chart with four cylindrical bars of increasing height on a square base, with a blue arrow showing upward growth trend.
WHo its for
Investment research teams, M&A strategy leads, corporate communications, and competitive intelligence functions at finance, private equity, corporate strategy, and large enterprise organizations.
Book a call

AI Pricing Copilot

Pricing decisions are being made too slowly, with incomplete data, and without a systematic view of the competitive landscape. Retailers are reacting to competitor price moves hours or days late. This leads to promotional budgets being allocated based on gut, not signal. Further more, bundle and assortment opportunities are invisible. The margin war is being fought with spread sheets.
Book a call
Dark-themed dashboard UI with sections for pricing analysis including Daily by Retail, Quaterly by CRM, Montly by Merchandising, Weekly by Client Tier. A graph titled Brand Erosion Guardrail shows a descending blue curve with X-axis labeled from Index -3 to Index +3 around a Base index. Suggested Actions list includes VIP Client Segment, Flagship Store / Paris, Luxury Comps, and Mass-Market Benchmark with notes on promo opportunities and policy rules.

We deploy an AI agent that monitors competitor prices, promotional activity, bundle structures, and assortment moves at internet speed, and then synthesizes that signal with your own margin structure, inventory position, and sales velocity to surface actionable pricing decisions. We’re not talking about recommendations on a dashboard that get ignored, but decisions with context, guardrails, and integration into your pricing workflow.
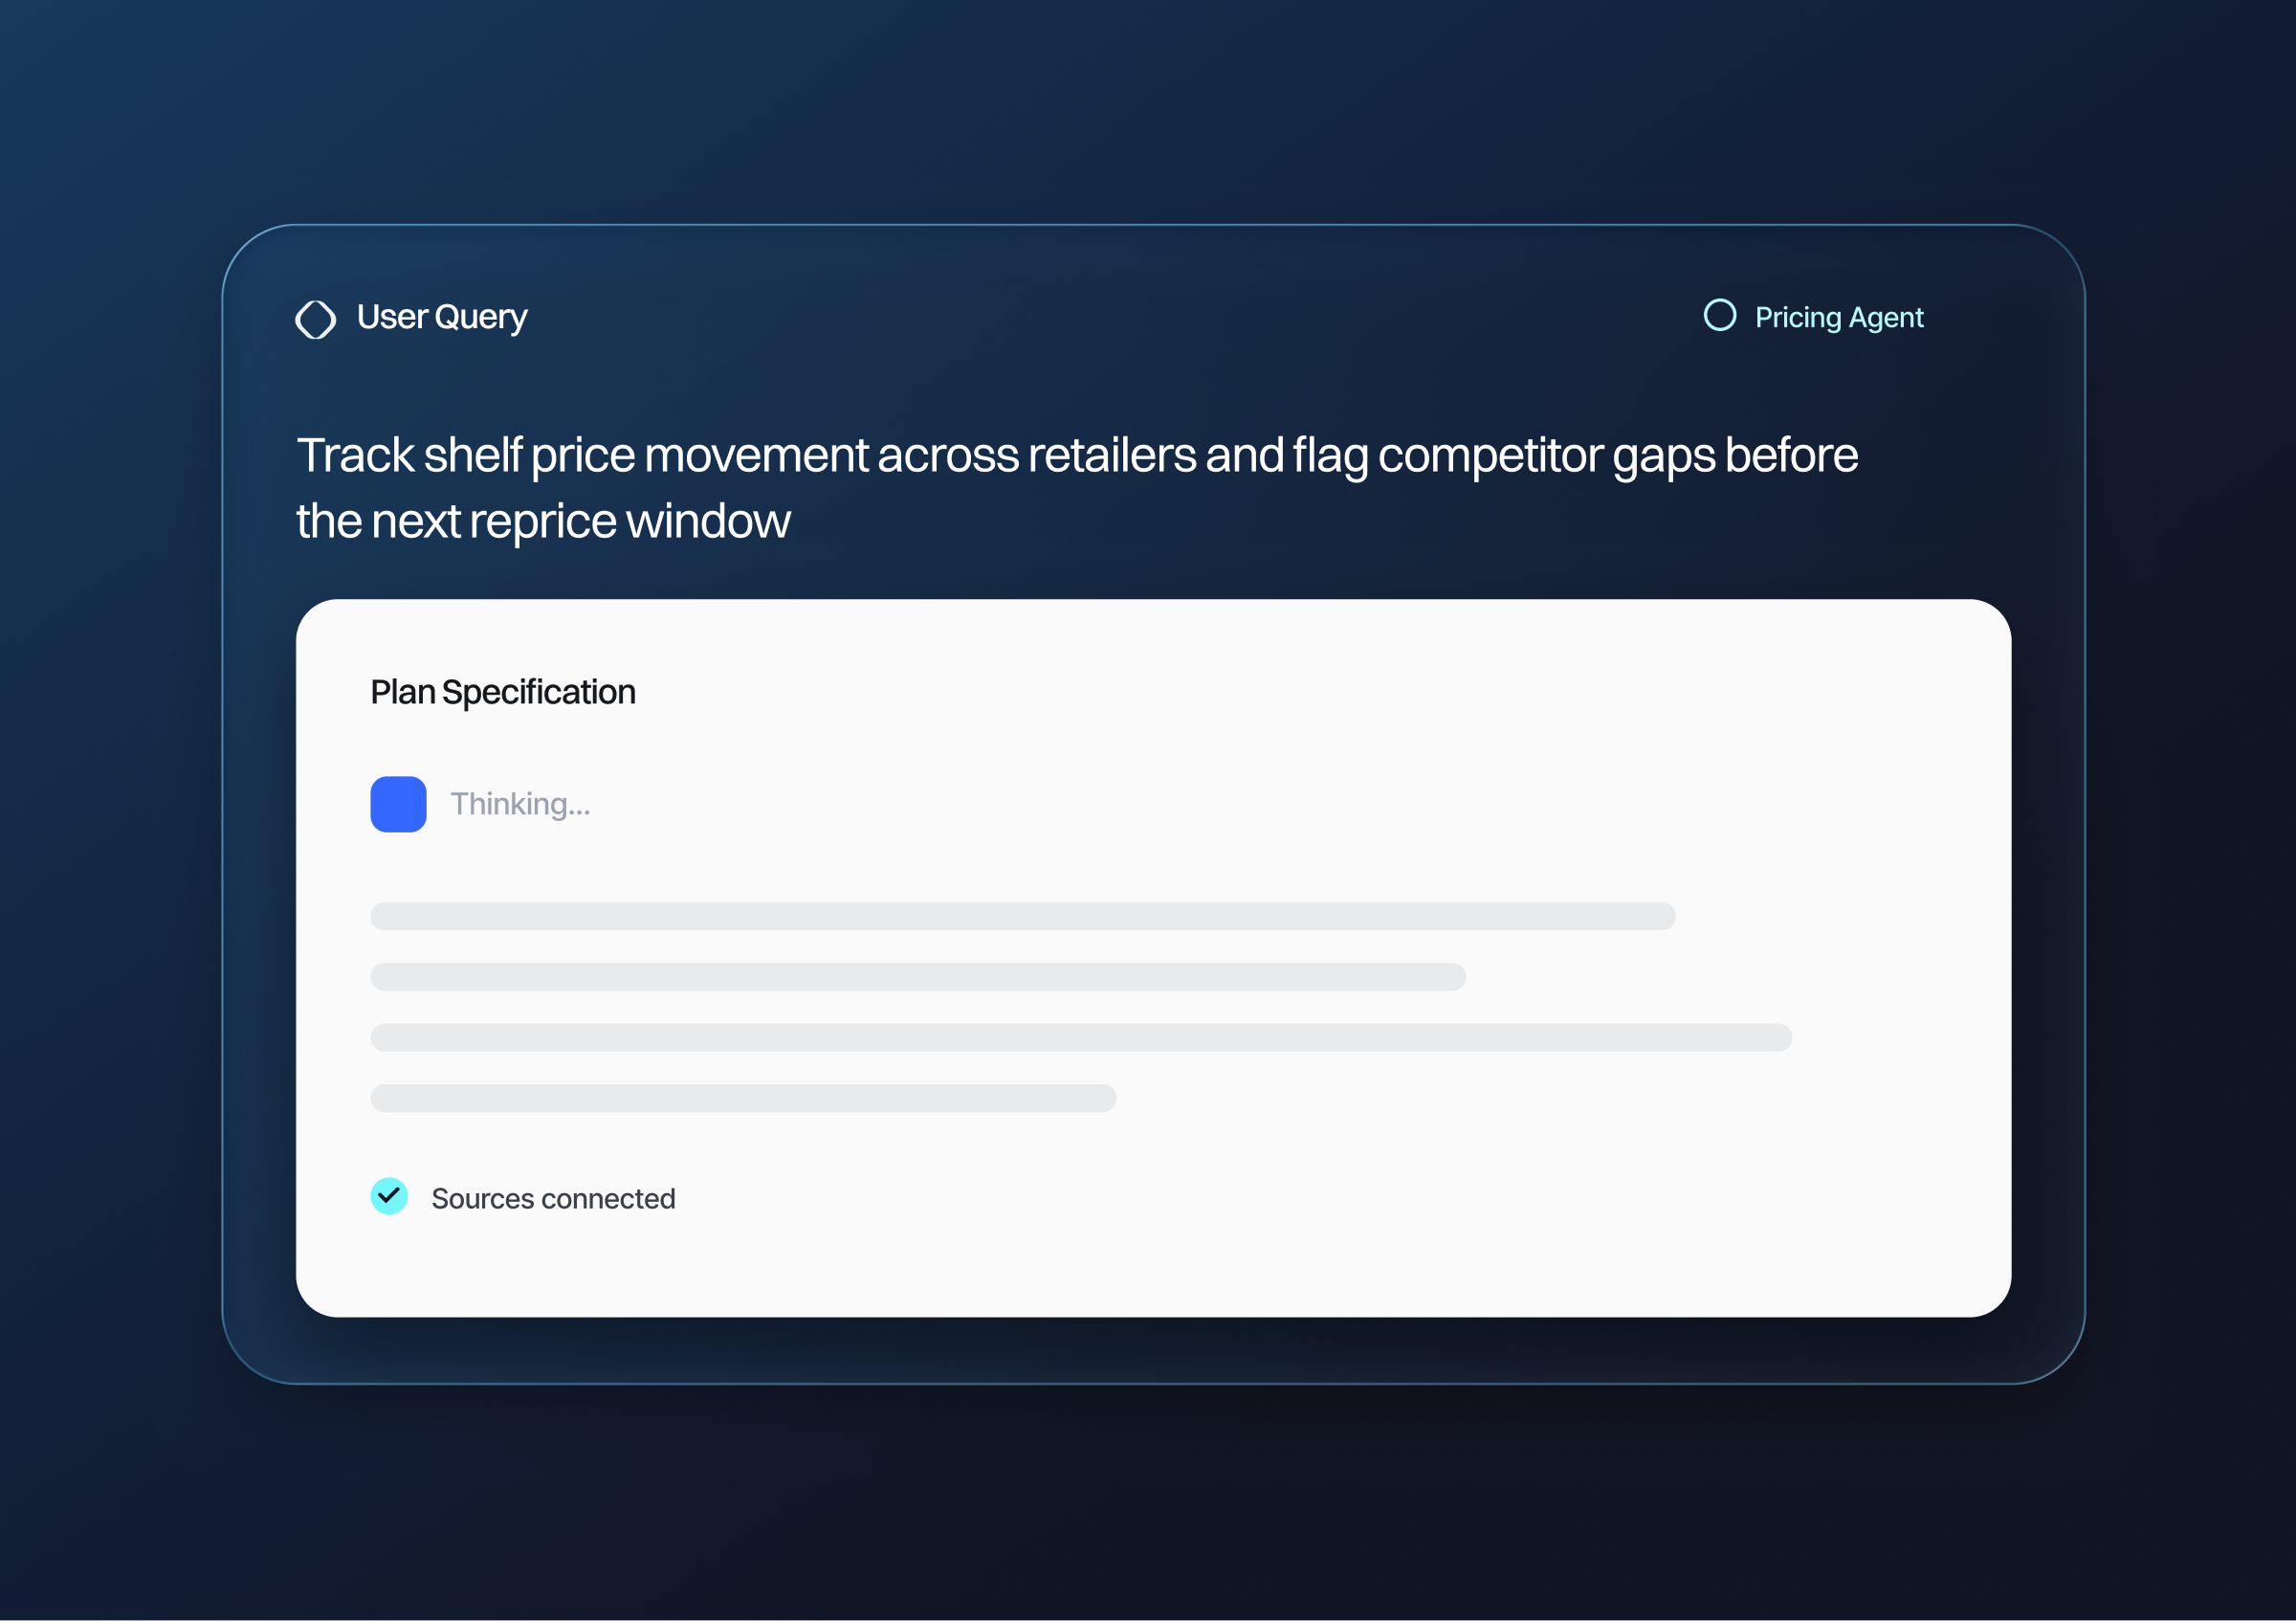
User query interface showing a task to track shelf price movement across retailers and flag competitor gaps before the next reprice window, with a plan specification section indicating 'Thinking...' and confirming sources connected.
Capabilities
Real-time competitor price monitoring on web, dark stores, and quick commerce platforms
Promotional intelligence encompassing competitor promo patterns, timing, depth, and category targeting
Dynamic bundling and assortment gap analysis
Margin-aware recommendation engine
Surge pricing logic for demand-sensitive SKUs or categories
Integration into existing pricing tools, ERP, and merchandising systems

Results

Margin uplift through faster, more accurate competitive response

Illustration of stacked blue and gray rectangular layers with a blue circular target above them and a blue arrow curving upward and to the right, symbolizing growth or progress.
Reduced promo leakage, when budget is spent where it moves volume, not where it was always spent.
Isometric illustration of seven blue cylindrical bars of varying heights arranged on a blue square platform, representing a 3D bar chart or data visualization.
Faster competitive response time in hours, not days
Isometric illustration of three blue server towers on a platform with a glowing white screen behind them, representing data or network storage.
Improved conversion through dynamic bundle and assortment optimization
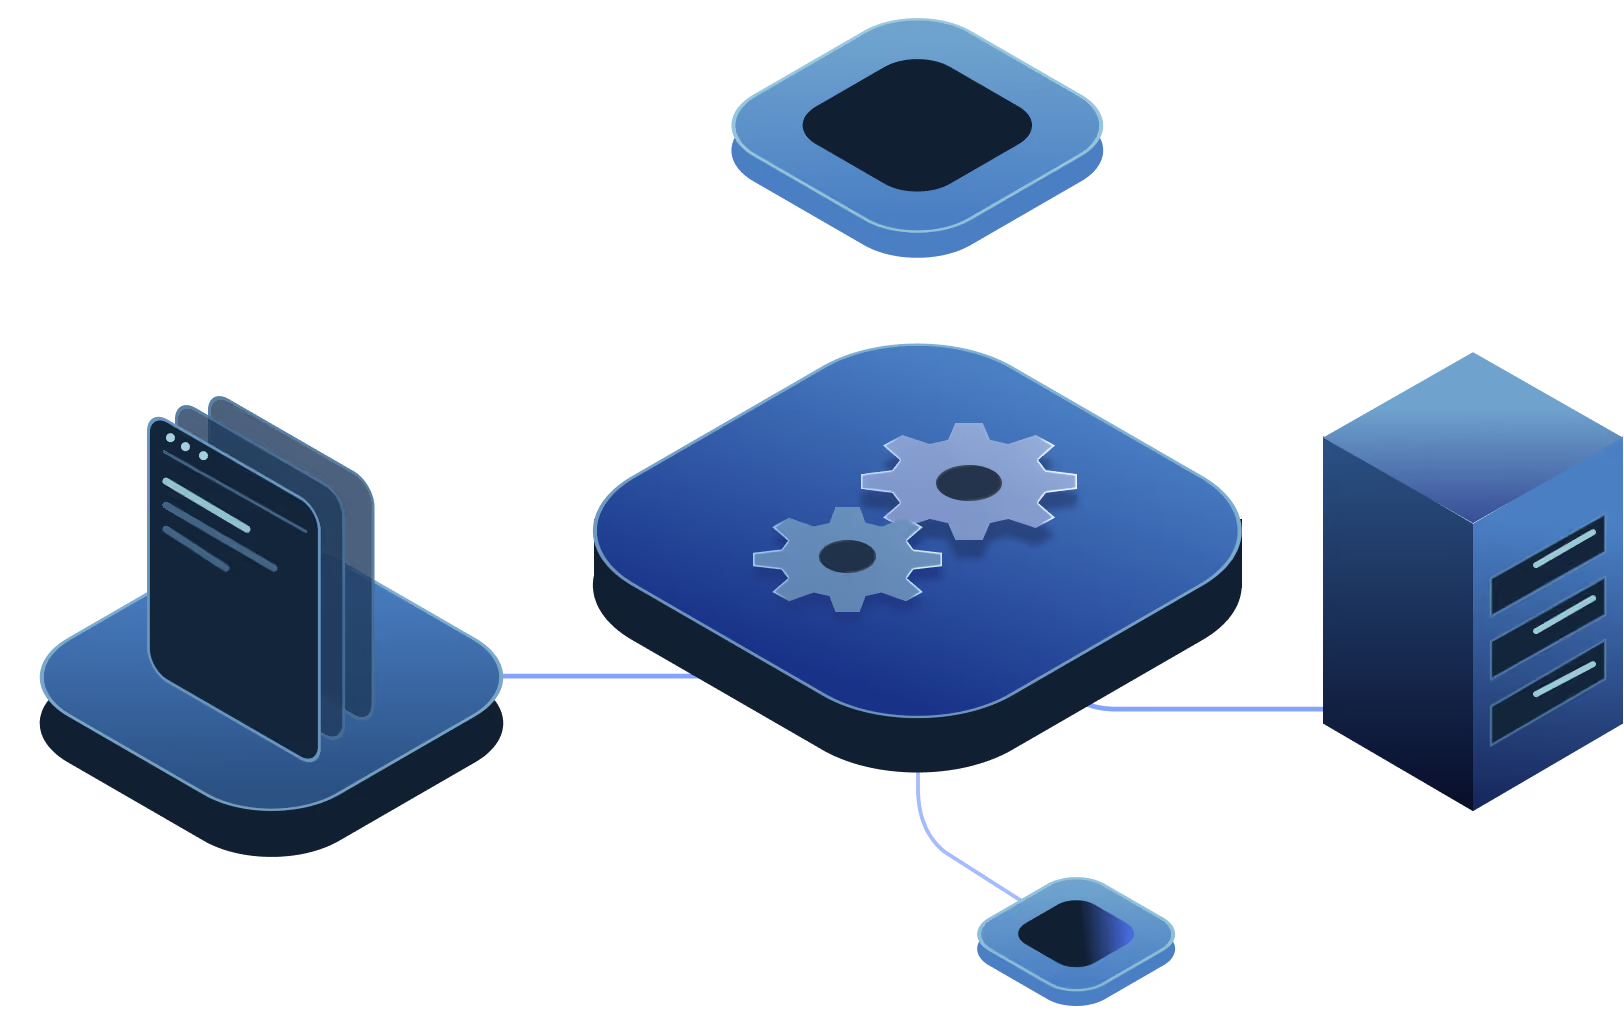
Isometric illustration of a blue technology system with interconnected components: a central square with two gears, a stack of blue files or documents on the left, a blue server tower on the right, and two smaller diamond-shaped blocks above and below the central block.
WHo its for
Pricing managers, category directors, and CMOs at retailers, e-commerce operators, FMCGbrands, and hospitality groups operating in competitive, price-sensitive markets.
Book a call

AI Stock Copilot

Stock decisions are made with stale data, siloed systems, and rules built for last year's demand patterns in a world that is thinking 10 years ahead. Stockouts erode revenue as well as customer trust. Overstock ties up working capital and creates markdown pressure. Manual replenishment processes can't keep pace with demand volatility. The inventory is there but it's just in the wrong place. That’s where we come in.
Book a call
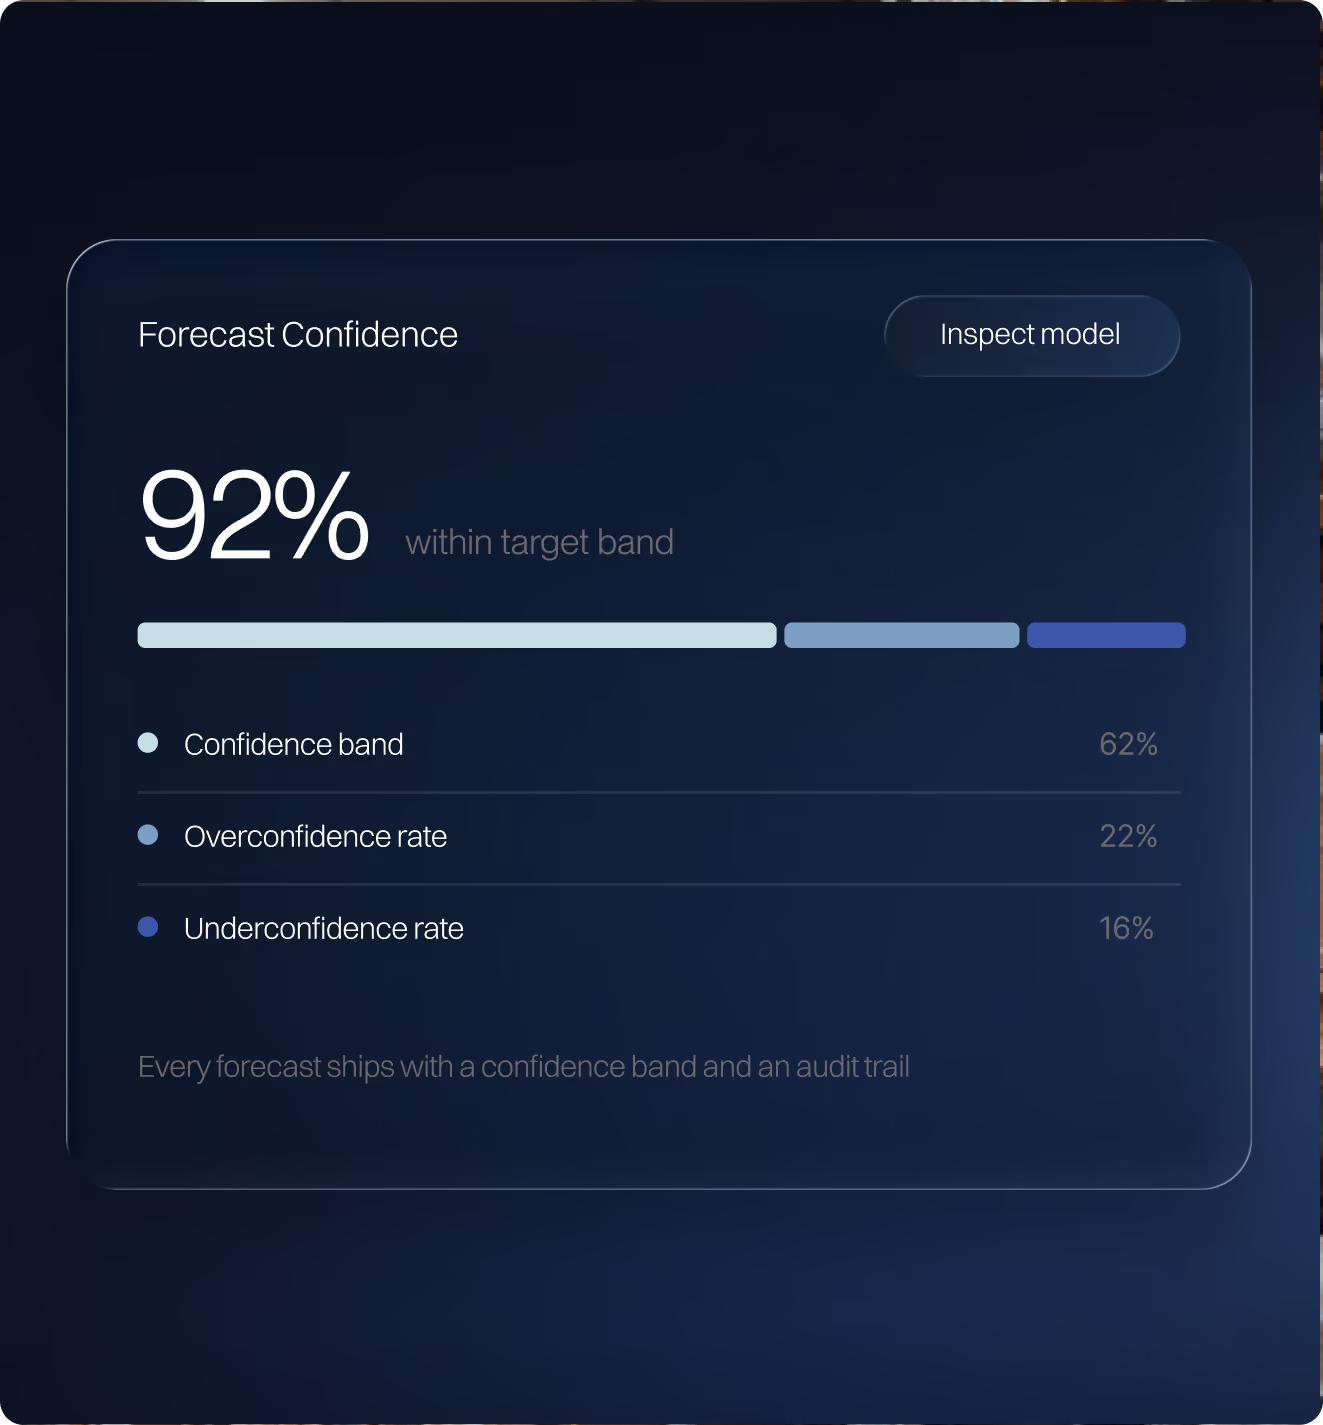
Forecast confidence interface showing 92% within target band with a horizontal bar divided into three colored segments representing confidence band at 62%, overconfidence rate at 22%, and underconfidence rate at 16%. There is a button labeled Inspect model and a note stating every forecast ships with a confidence band and an audit trail.
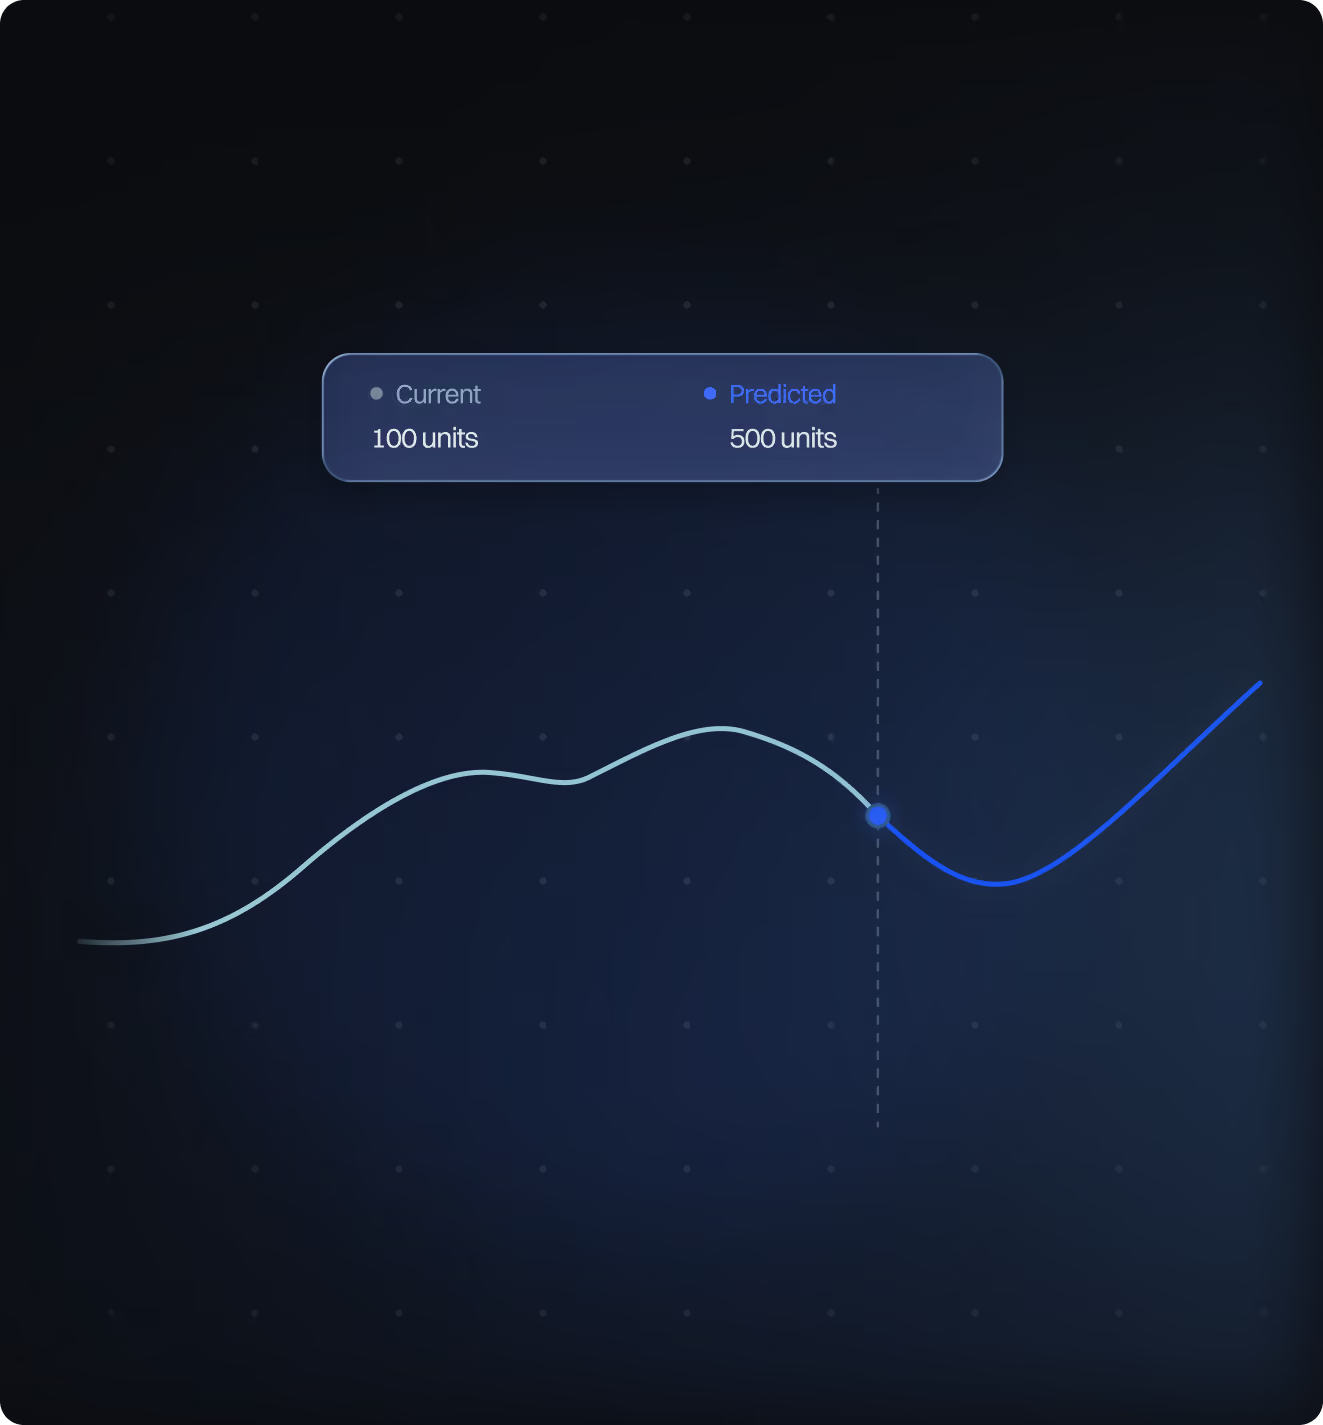
Line graph on dark background showing two segments: a light blue current trend reaching 100 units and a blue predicted trend rising to 500 units beyond a vertical dashed line marker.

We deploy an AI agent that continuously optimizes stock performance across the full availability loop, replenishment forecasting at SKU level, assortment optimization by store or channel, and purchase order planning aligned to actual demand signals. The agent connects to your ERP, WMS, POS, and supplier systems, learns demand patterns at granular levels, and surfaces decisions before stockouts happen, not after.
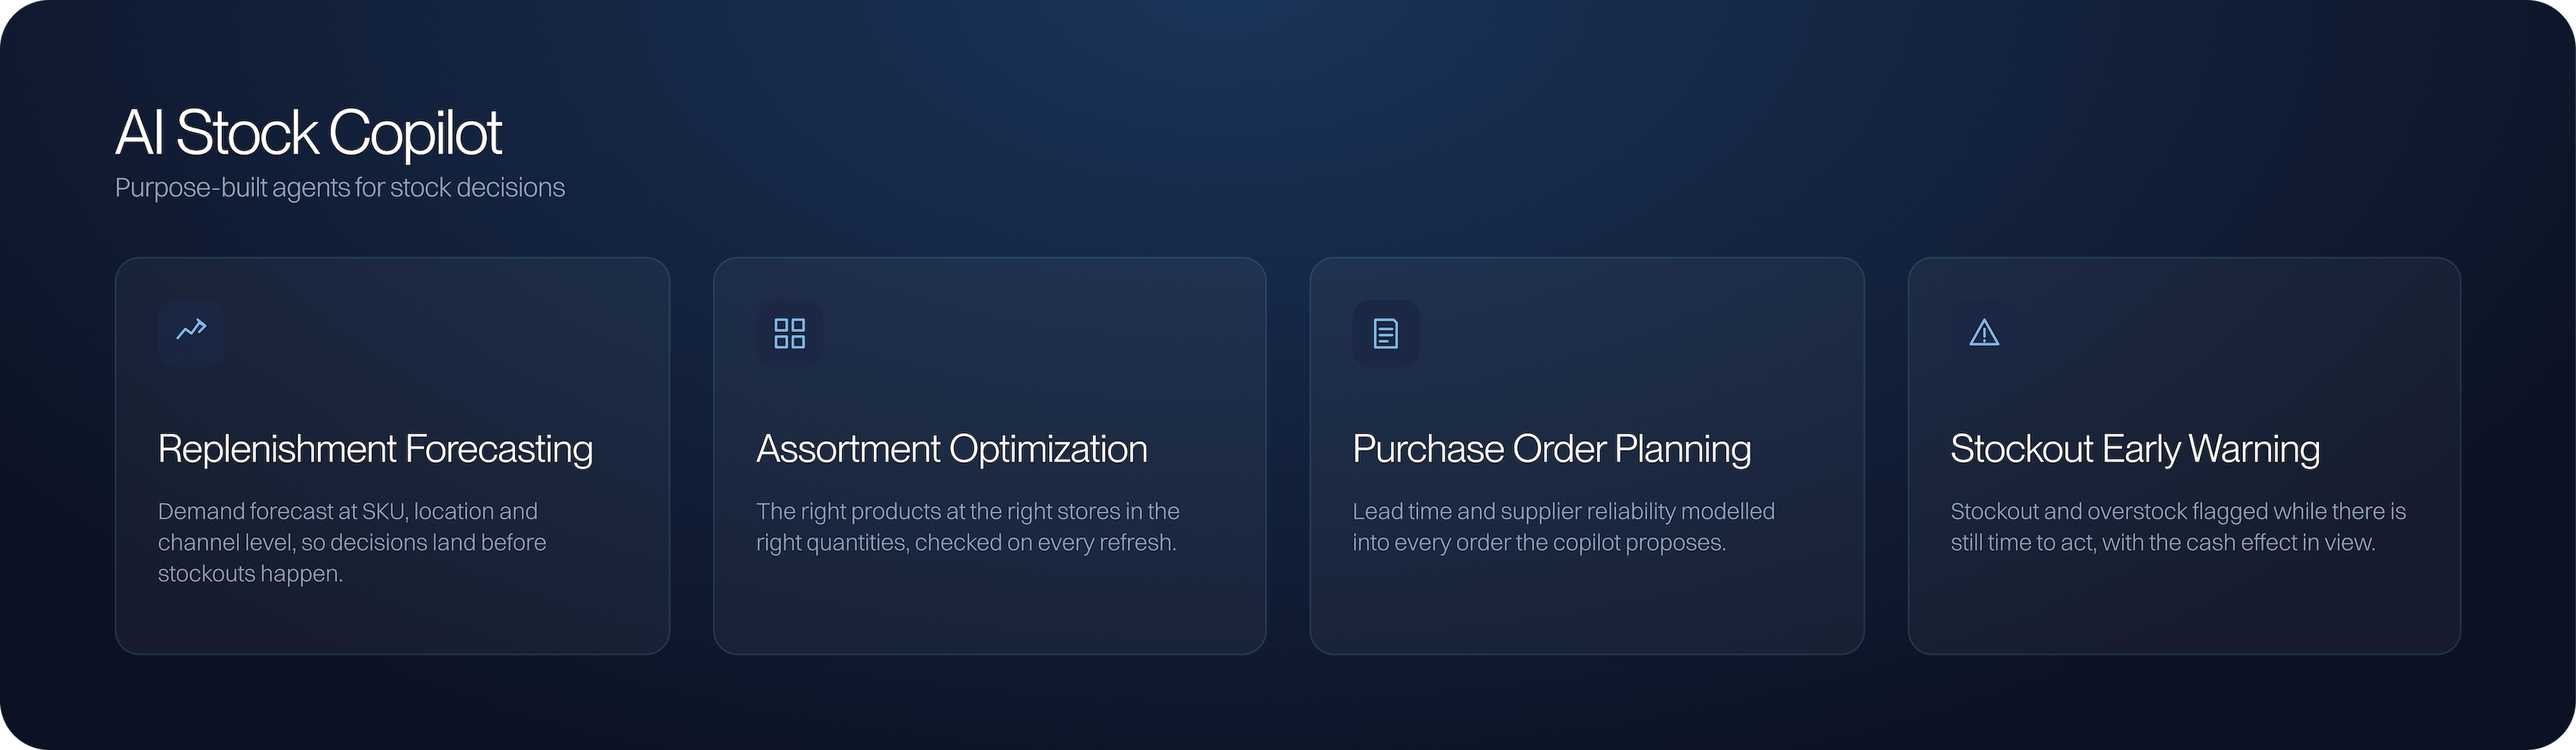
User interface titled AI Stock Copilot with four purpose-built agent features: Replenishment Forecasting for demand forecasting at SKU, location, and channel levels; Assortment Optimization ensuring the right products at the right stores in correct quantities; Purchase Order Planning modeling lead time and supplier reliability in orders; and Stockout Early Warning flagging stockouts and overstocks timely with cash effects visible.
Capabilities
Replenishment forecasting at SKU, location, channel level
Assortment optimization making sure the right products are at the right stores in the right quantities
Purchase order planning with lead time and supplier reliability modeling
Stockout and overstock early-warning system
Working capital impact modeling so you can see the cash effect of inventory decisions
Integration with ERP (SAP, Oracle), WMS, POS, and supplier EDI

Results

Reduction in stockout frequency and lost sales
Vertical bar chart comparing eight categories with values: Category 1 around 31, Category 2 around 44, Category 3 around 36, Category 4 highest at about 53, Category 5 about 42, Category 6 lowest about 19, Category 7 about 33, Category 8 about 46.
Improved fill rates and supplier relationship management
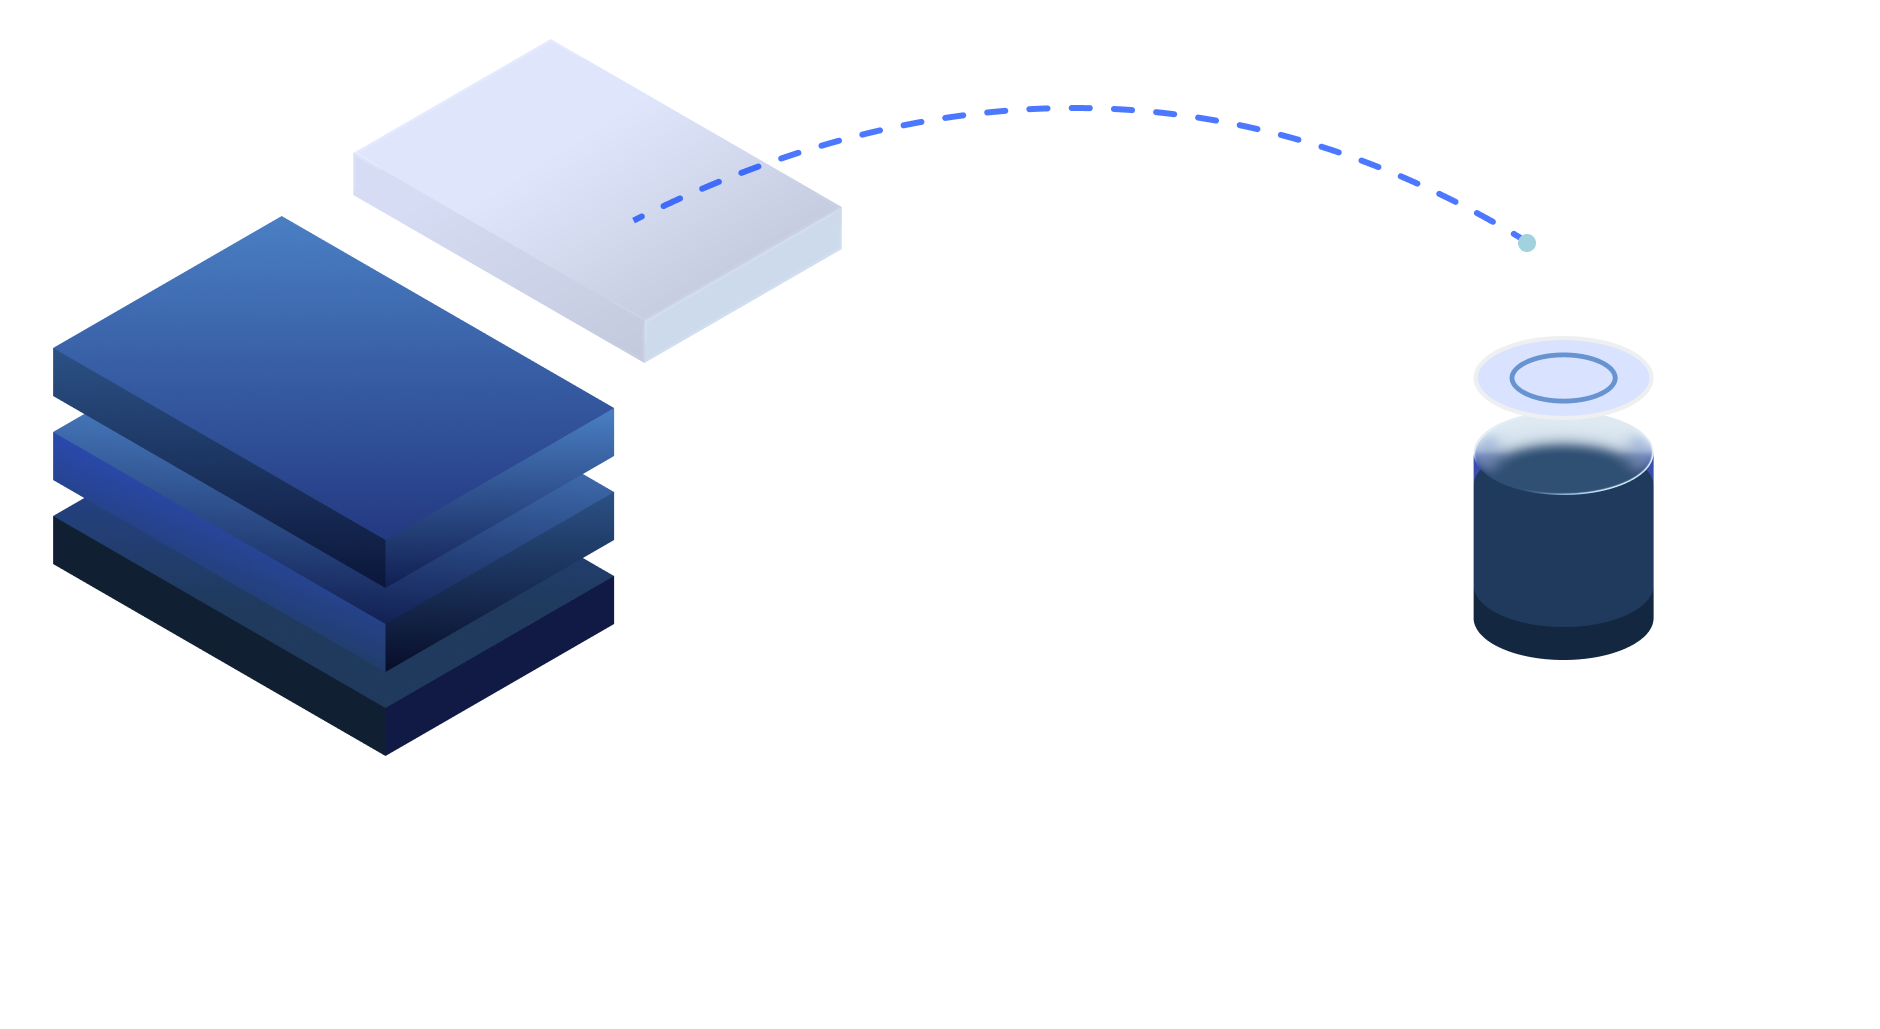
Illustration of cloud storage and a blue container representing data transfer or storage, linked by a dashed curved blue line.
Lower overstock levels and reduced markdown pressure
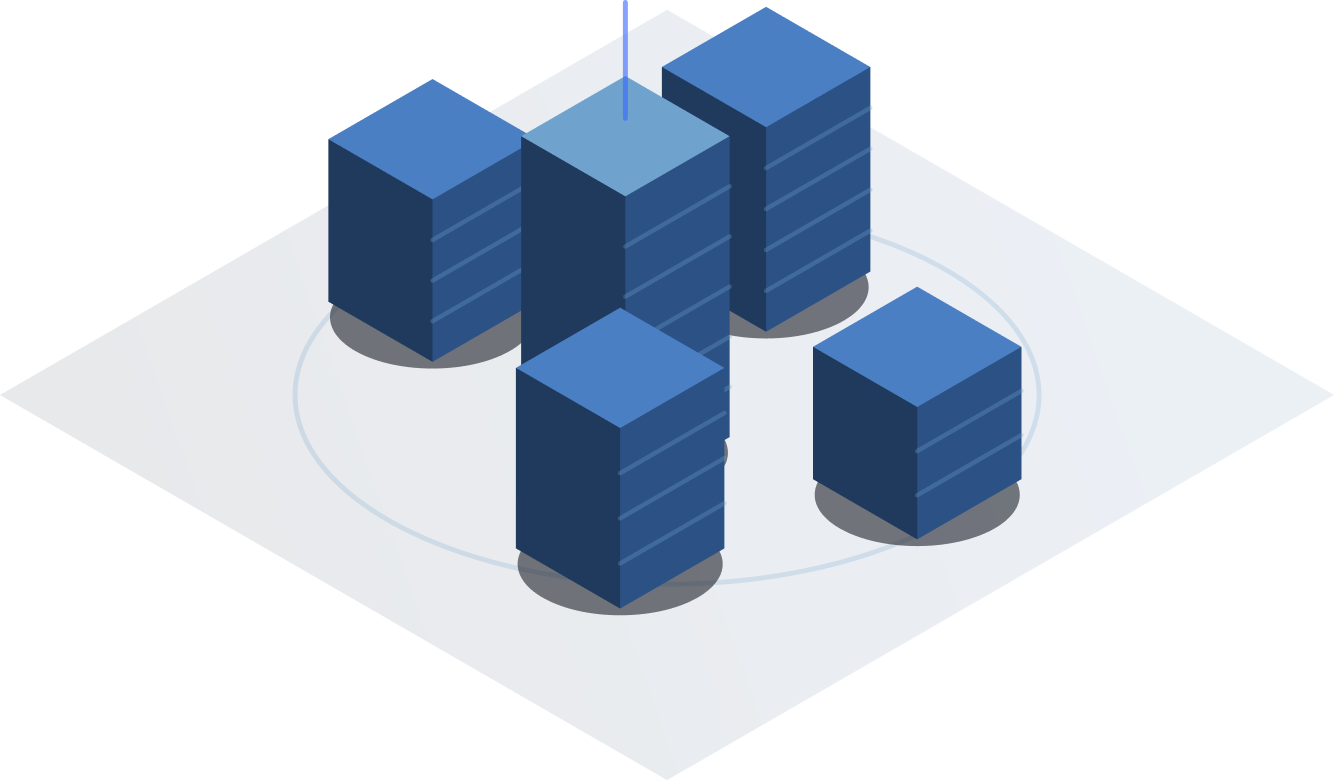
Isometric illustration of five blue server racks arranged in a circular pattern on a white hexagonal platform with shadows beneath each rack.
Reduced data team overhead spent on reconciliation
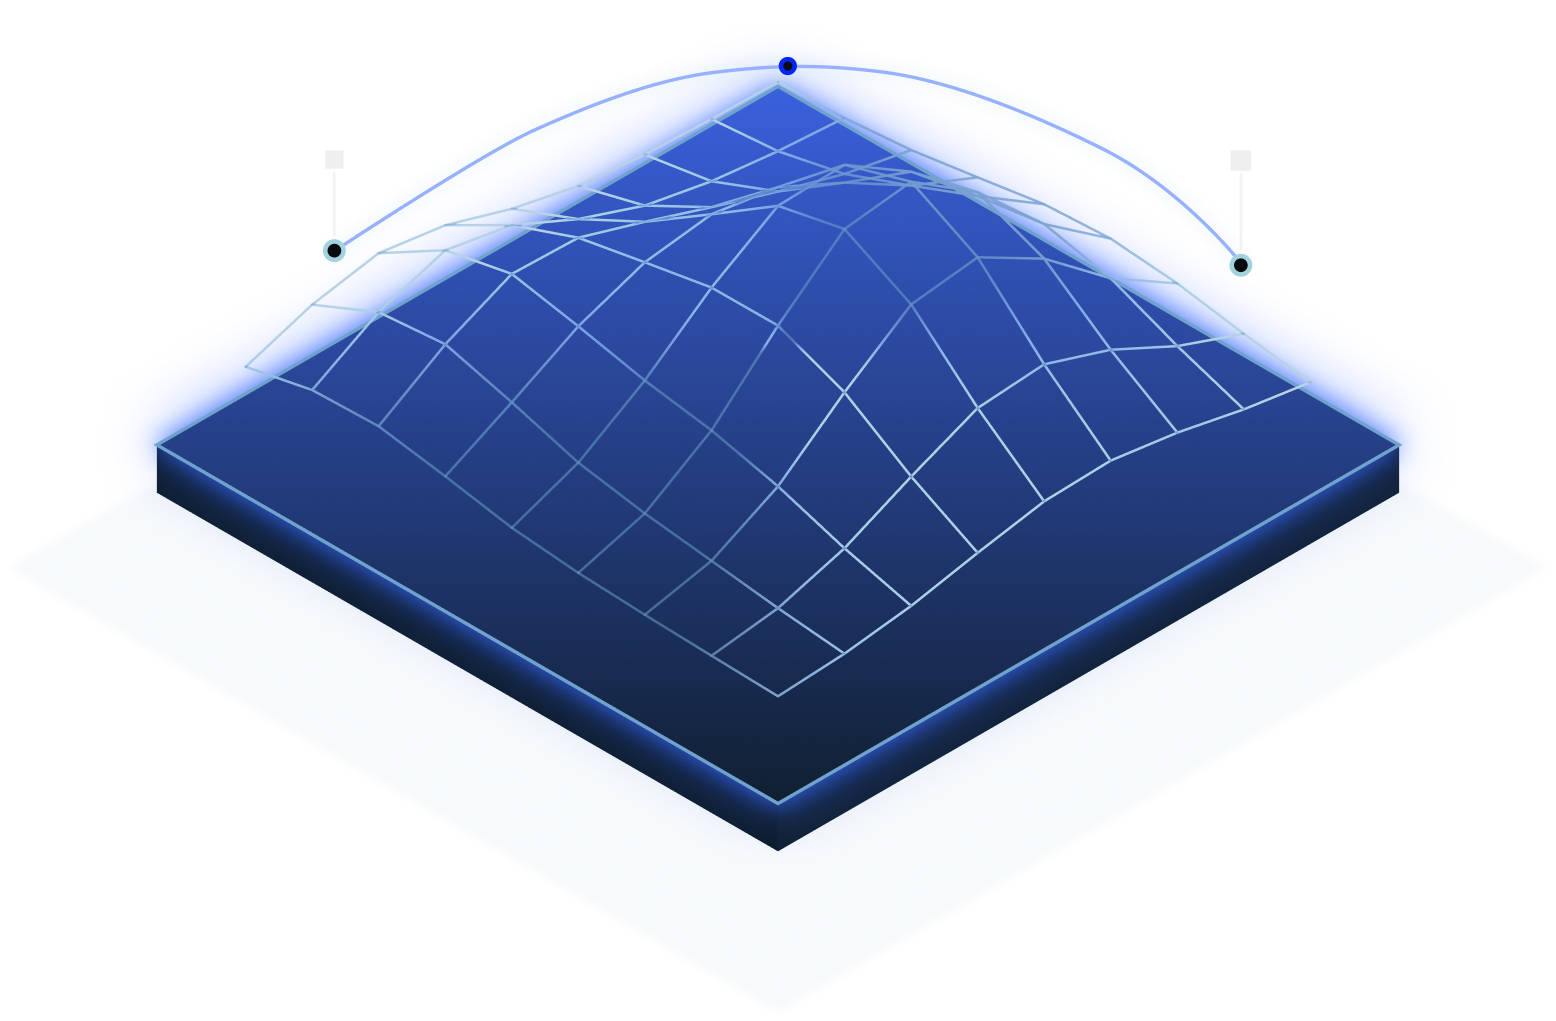
3D blue grid surface plot with a wavy line on top illustrating a data trend or function over the grid.
WHo its for
Supply chain directors, inventory managers, and operations leads at retailers, automotive dealers, hospitality operators, and telco companies managing physical inventory acrossmultiple locations.
Book a call

AI Shipment & Routing Optimization Agent

Most routing systems are built on yesterday's constraints. They optimize for a static snapshot built on planned routes, estimated times, assumed capacity. And they all fall apart when reality deviates, which it always does. Traffic changes, roadblocks (literal ones), capacity shifts, service windows tighten – all these result in missed SLAs, inflated delivery costs, and fleet inefficiency that compounds daily.
Book a call
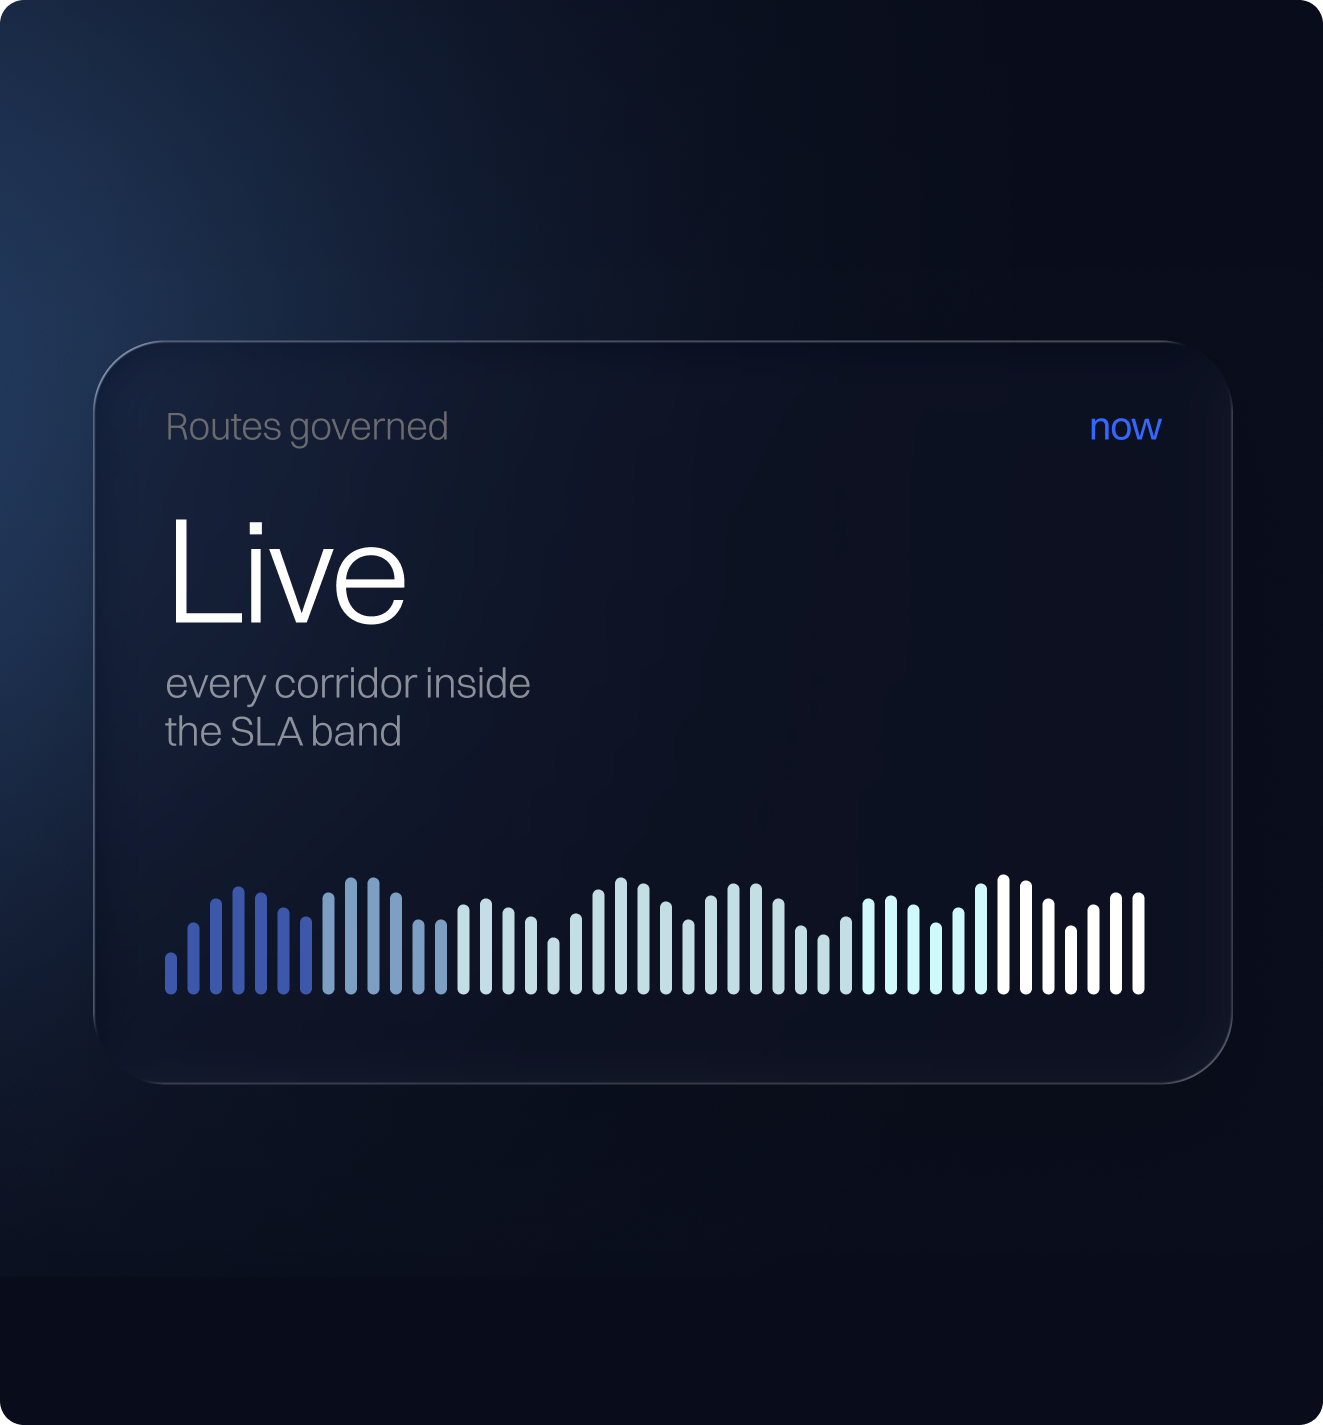
Dark interface card displaying the phrase 'Routes governed Live every corridor inside the SLA band' with a blue-to-white waveform pattern at the bottom and the word 'now' in blue at the top right.
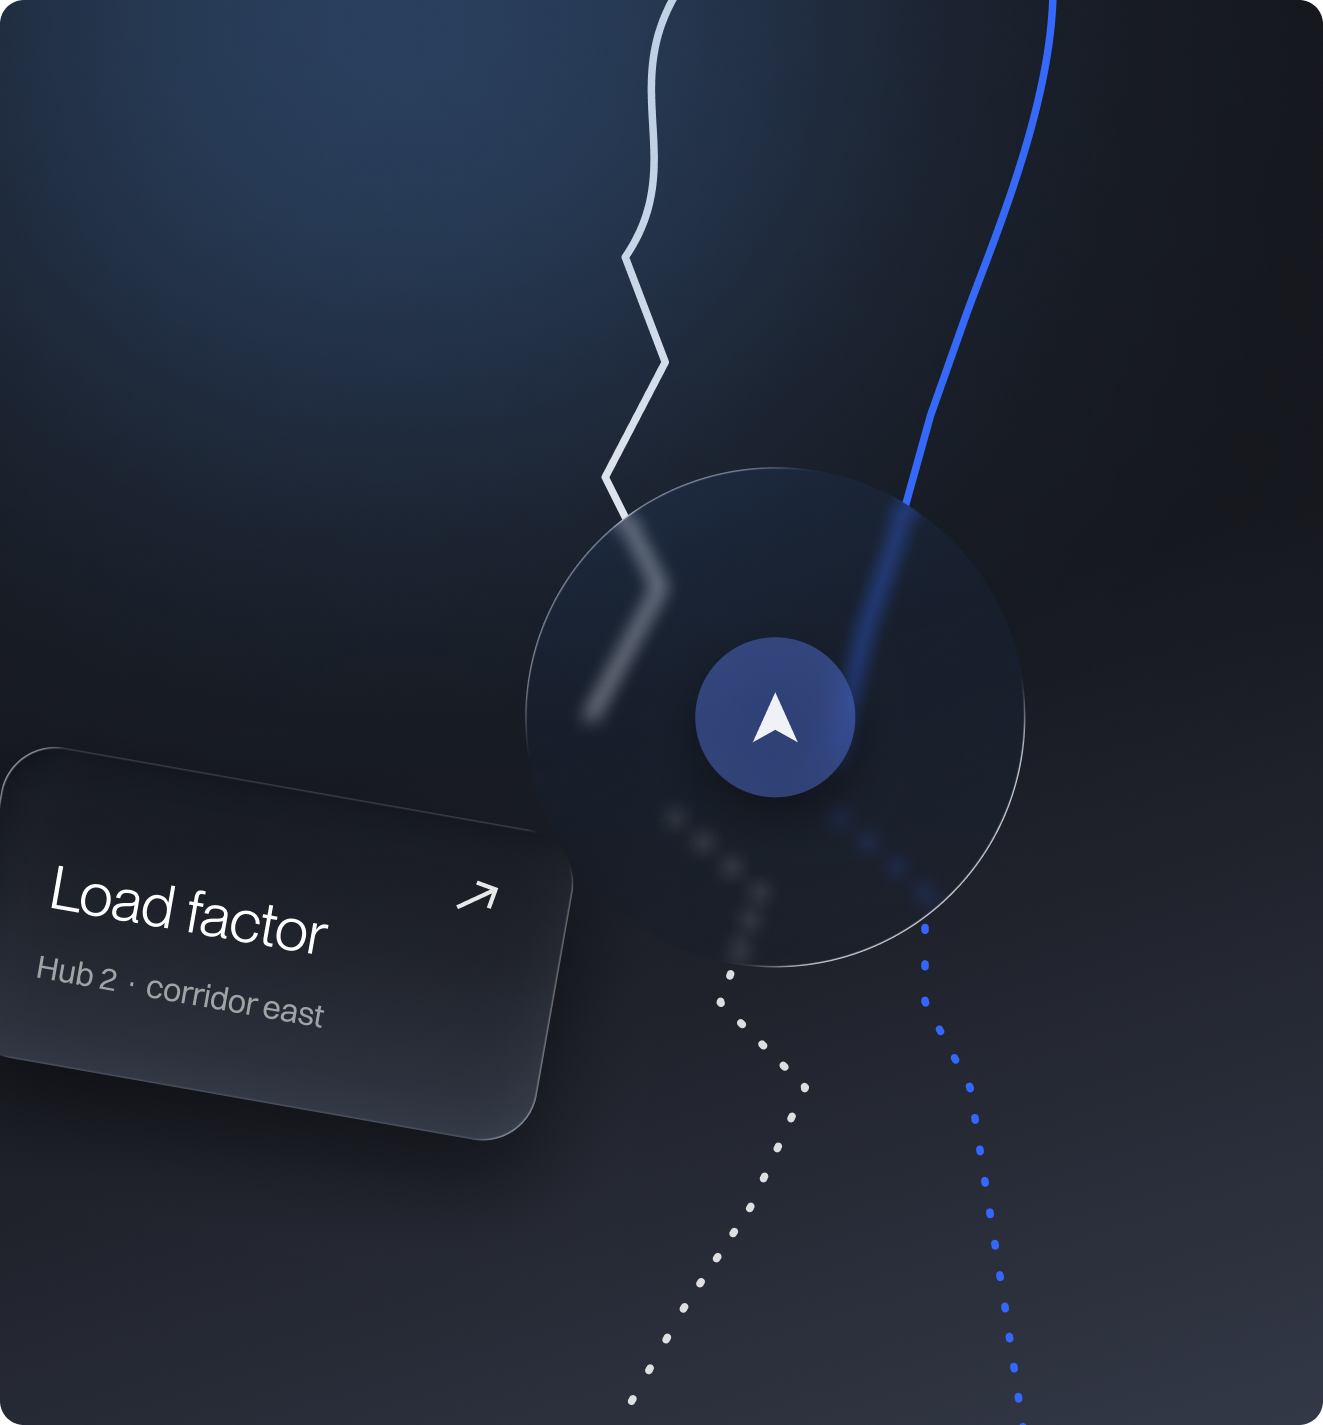
Dark-themed abstract digital interface with a navigation arrow icon inside a circular overlay, zigzag dotted lines in white and blue, and a label reading 'Load factor Hub 2 · corridor east' with an arrow indicating more details.

We deploy a real-time geospatial and predictive optimization agent that continuously recomputes routing under live constraints not as a one-time plan but as a continuous decision loop. The agent ingests live traffic signals, capacity data, service window commitments, and historical performance patterns to optimize across the full network: last mile, hub-to-hub, carrier allocation, and fleet utilization.

Diagram titled 'AI Shipment & Routing' showing optimal route selection with multiple routes (A, B, C) starting from Tender to a location marked with a pin, with constraints like 'Within SLA', and elements labeled Dispatch, Carrier, and Asset, highlighting route efficiency with fewer miles and same SLA.
Capabilities
Dynamic route optimization under live constraints, be it traffic, weather, capacity, service windows
Predictive service-window alerting which flags SLA risk before it becomes a breach
Fleet and carrier allocation optimization to bring miles down, utilization up
Network-level optimization across hubs, regions, and third-party carriers
Historical pattern learning that improves over time as the agent learns your network
Integration with TMS, WMS, carrier APIs, and fleet management systems

Results

Reduced delivery cost per order with fewer miles, and better load factors
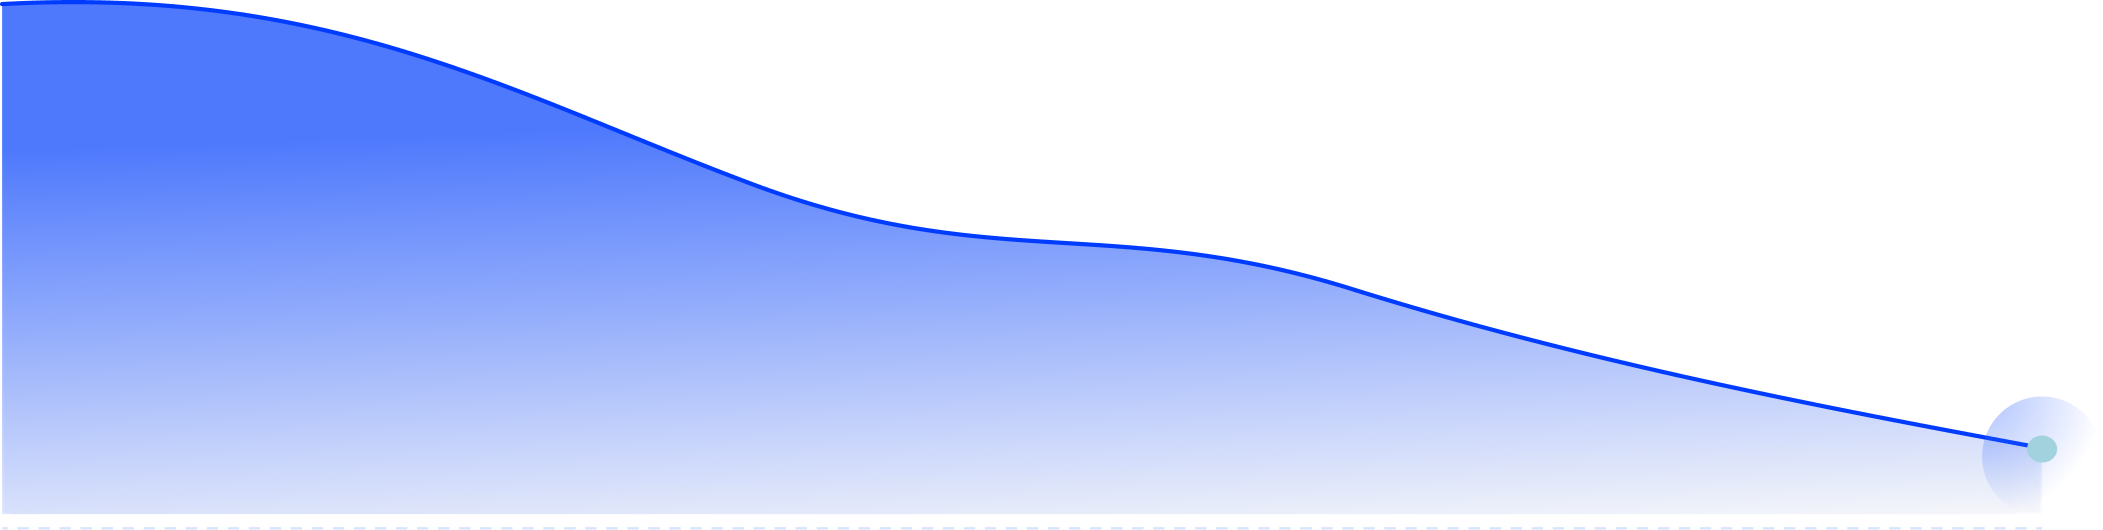
Blue gradient area chart with a smooth decreasing curve from left to right ending at a highlighted point on the bottom right, against a black background with white horizontal grid lines.
Improved SLA performance with fewer late deliveries, and even fewer penalties
Circular progress bar with a small blue segment and a white dot near the top left, above four horizontal bar graphs of varying lengths and shades of blue on a dark gradient circular background.
Better fleet utilization to reduce empty miles and idle capacity
3D bar chart with nine vertical blue bars of varying heights on a dark blue platform, with a dashed arrowed line indicating a trend moving upward from left to right against a black background with grid and axis lines.
Network-level visibility across all carriers and routes

A translucent blue-gray globe with longitude and latitude lines resting on a dark blue square platform with glowing blue edges and a lighter blue background shadow.
WHo its for
Logistics directors, operations managers, and supply chain leads at 3PLs, retailers, automotive distributors, and any organization operating delivery networks at scale.
Book a call

Snowflake native apps

Databricks
Data Integrity Monitor
Outcome hooks: single source of truth, faster decisions, consistent KPIs, audit-ready reporting.
Governed semantic layer across all your sources Deployed on Snowflake, Databricks, AWS, Azure, or GCP Board-ready KPIs with lineage and audit trails
Deployed on Snowflake, Databricks, AWS, Azure, or GCP
Board-ready KPIs with lineage and audit trails
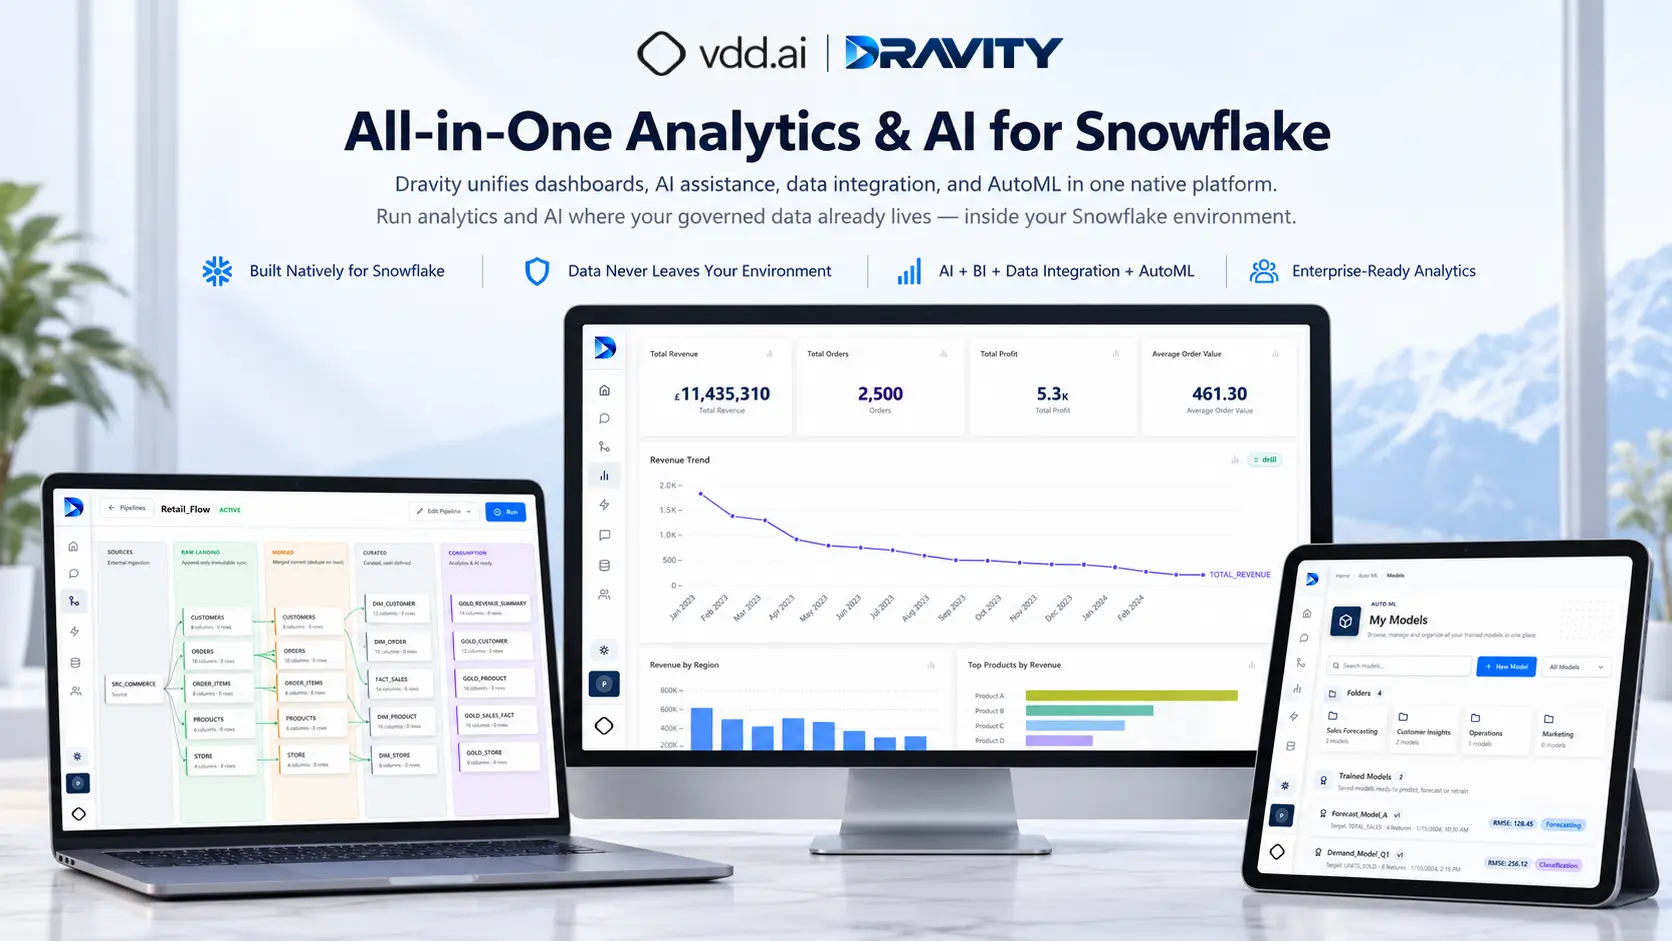
Explore Solution

Databricks native apps

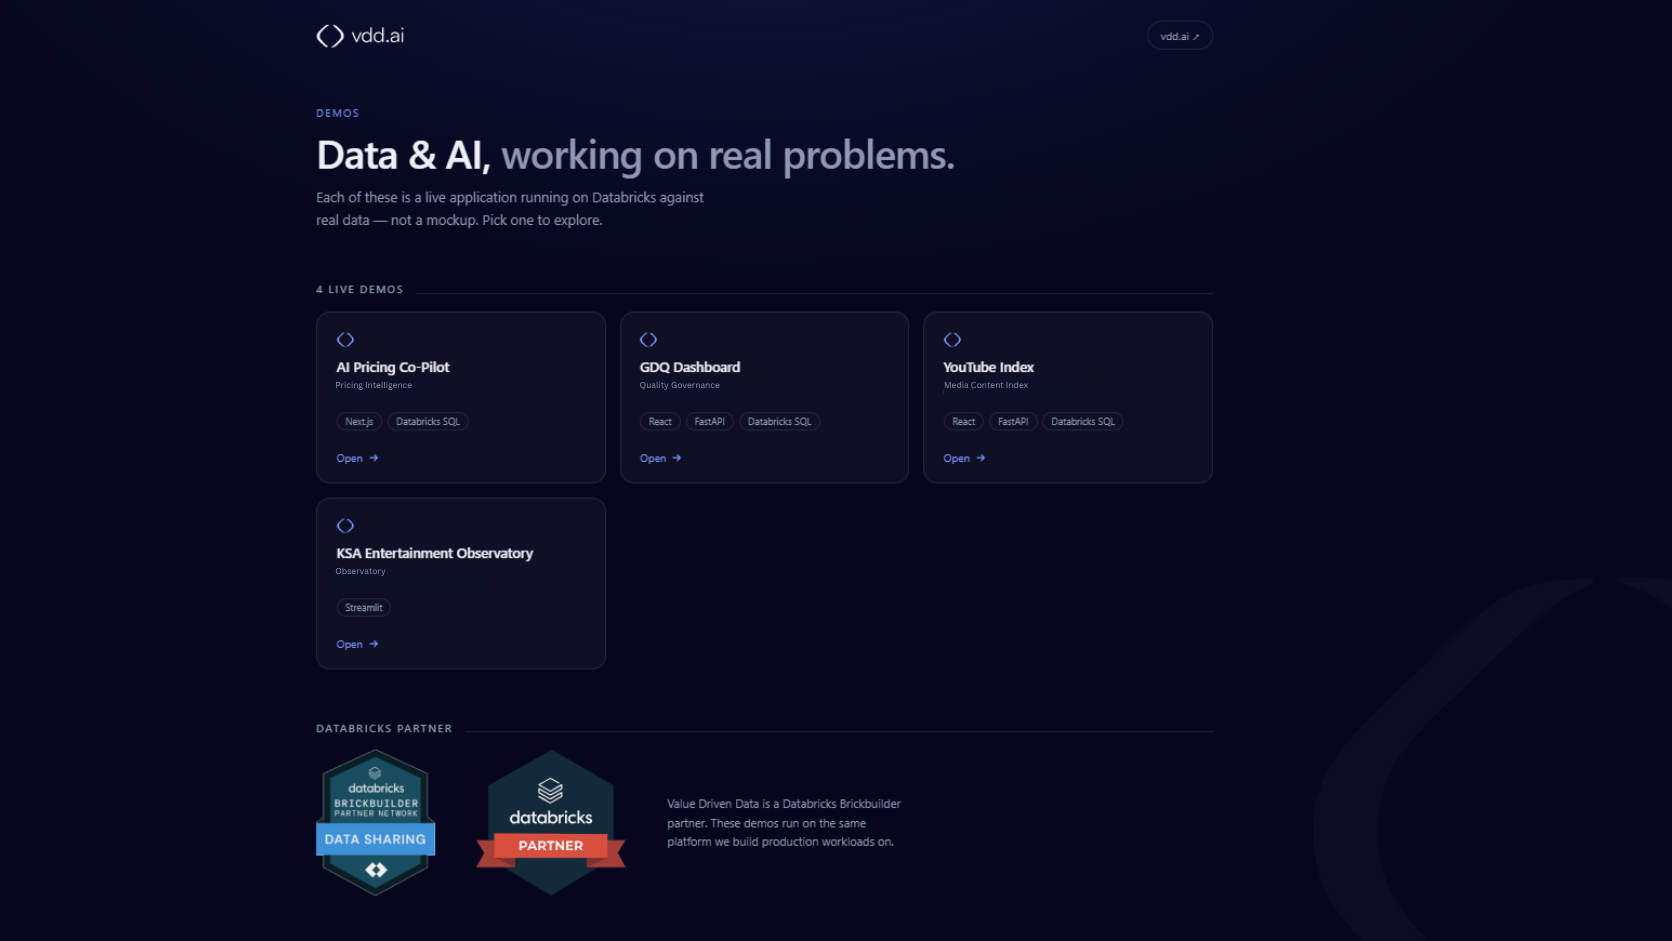
Webpage showcasing four live AI and data demos on Databricks: AI Pricing Co-Pilot with Next.js and Databricks SQL, GDQ Dashboard using React, FastAPI, and Databricks SQL, YouTube Index with React, FastAPI, Databricks SQL, and KSA Entertainment Observatory on Streamlit, with links to open each demo and Databricks partner badges at the bottom.
Databricks Native App
VDD AI Demo & Pilot Suite
Win the price war without racing to the bottom. Live competitor intelligence, promo optimization, and dynamic bundling — tuned to your margin structure, not someone else's playbook.
Live competitor intelligence and price matching
Promo optimization and dynamic bundling
Margin guardrails tuned to your brand, not a playbook
Preview