Frontier models are the engine. We build the vehicle.
Eight industries. One factory. Production agents tuned to the physics of your business — margin, availability, SLA, working capital — deployed on your stack, governed by design
Retail
Retail is a high-frequency war. Prices move hourly and promotions detonate without warning. Assortment gaps open and close with competitor moves. Quick commerce platforms are benchmarking your dark store availability in real time. And behind all of it, ERP systems that weren't built for this pace, siloed merchandising data, and reporting that arrives a week after decisions needed to be made.
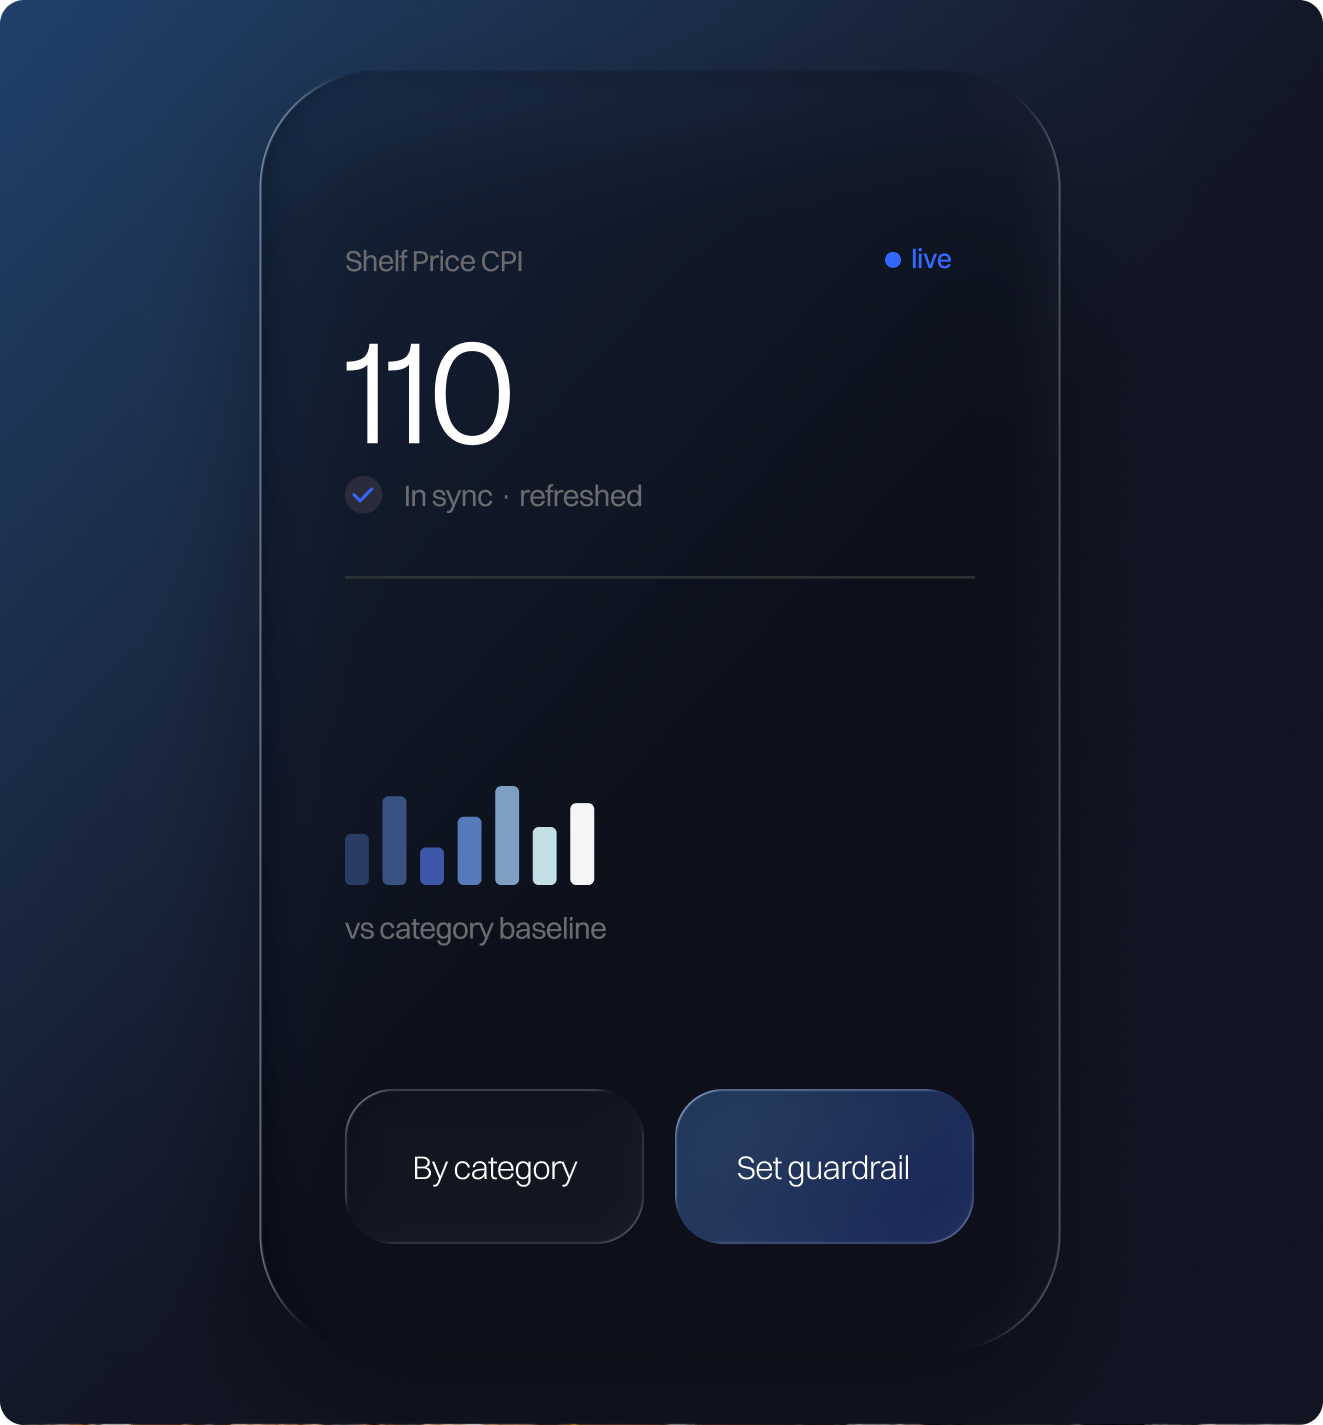


A margin-and-availability control tower that senses the market, interprets your operations, and executes decisions with guardrails, all deployed on your stack.

What vdd.ai Builds for Retail
Pricing intelligence at internet speed: competitor price monitoring across web, apps, dark stores, and quick-commerce platforms with a margin-aware recommendation engine.
Availability discipline: SKU-level replenishment intelligence that cuts stockouts andfrees working capital across all store formats and channels
Executive control: a governed semantic layer across POS, ERP, CRM, and e-commercethat gives leadership a single, trusted operational view
Promo optimization: signal-driven promotional planning that allocates budget to where it moves revenue, not where it was always spent




Automotive
Automotive operations are multi-entity by design: OEMs, regional distributors, dealer networks, parts suppliers, service operations, and fleet managers; each running their own systems, each with their own truth. Parts availability drives service revenue and customer retention, but fill rates suffer when inventory is misaligned to actual dealer demand. Distribution is complex, routing is manual, and the executive view is assembled from spreadsheets.
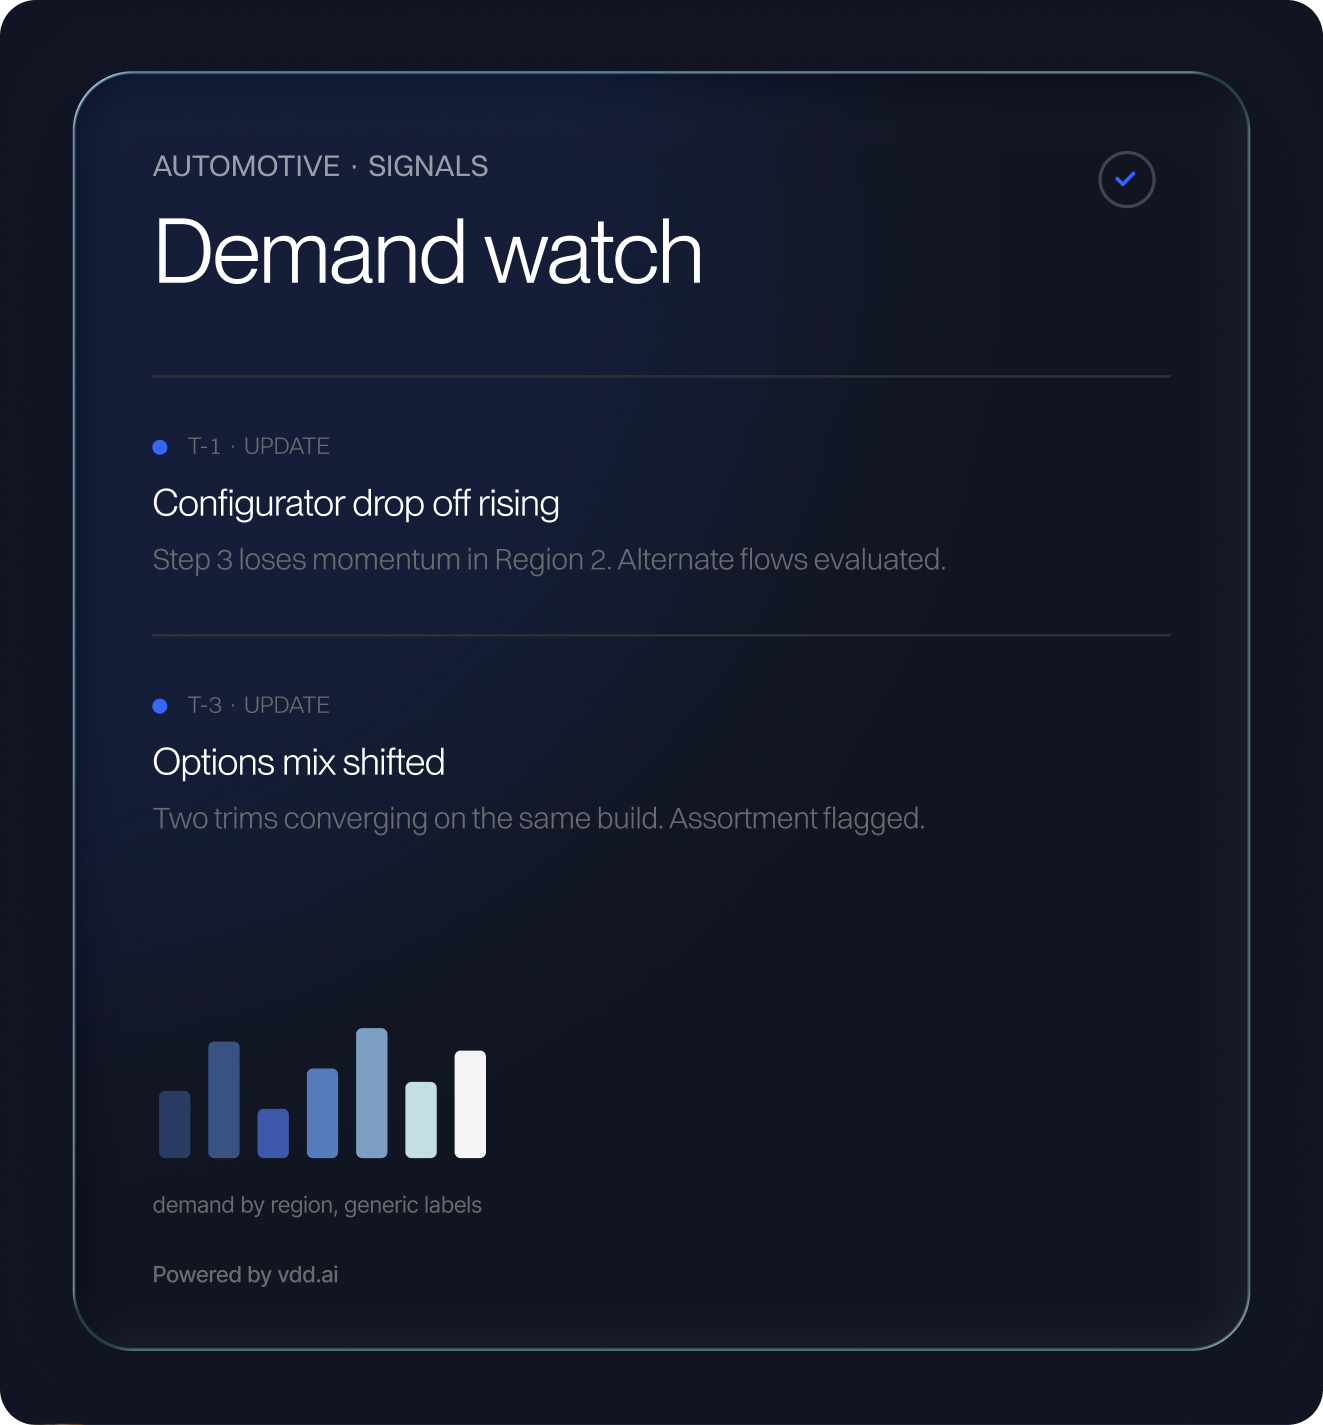

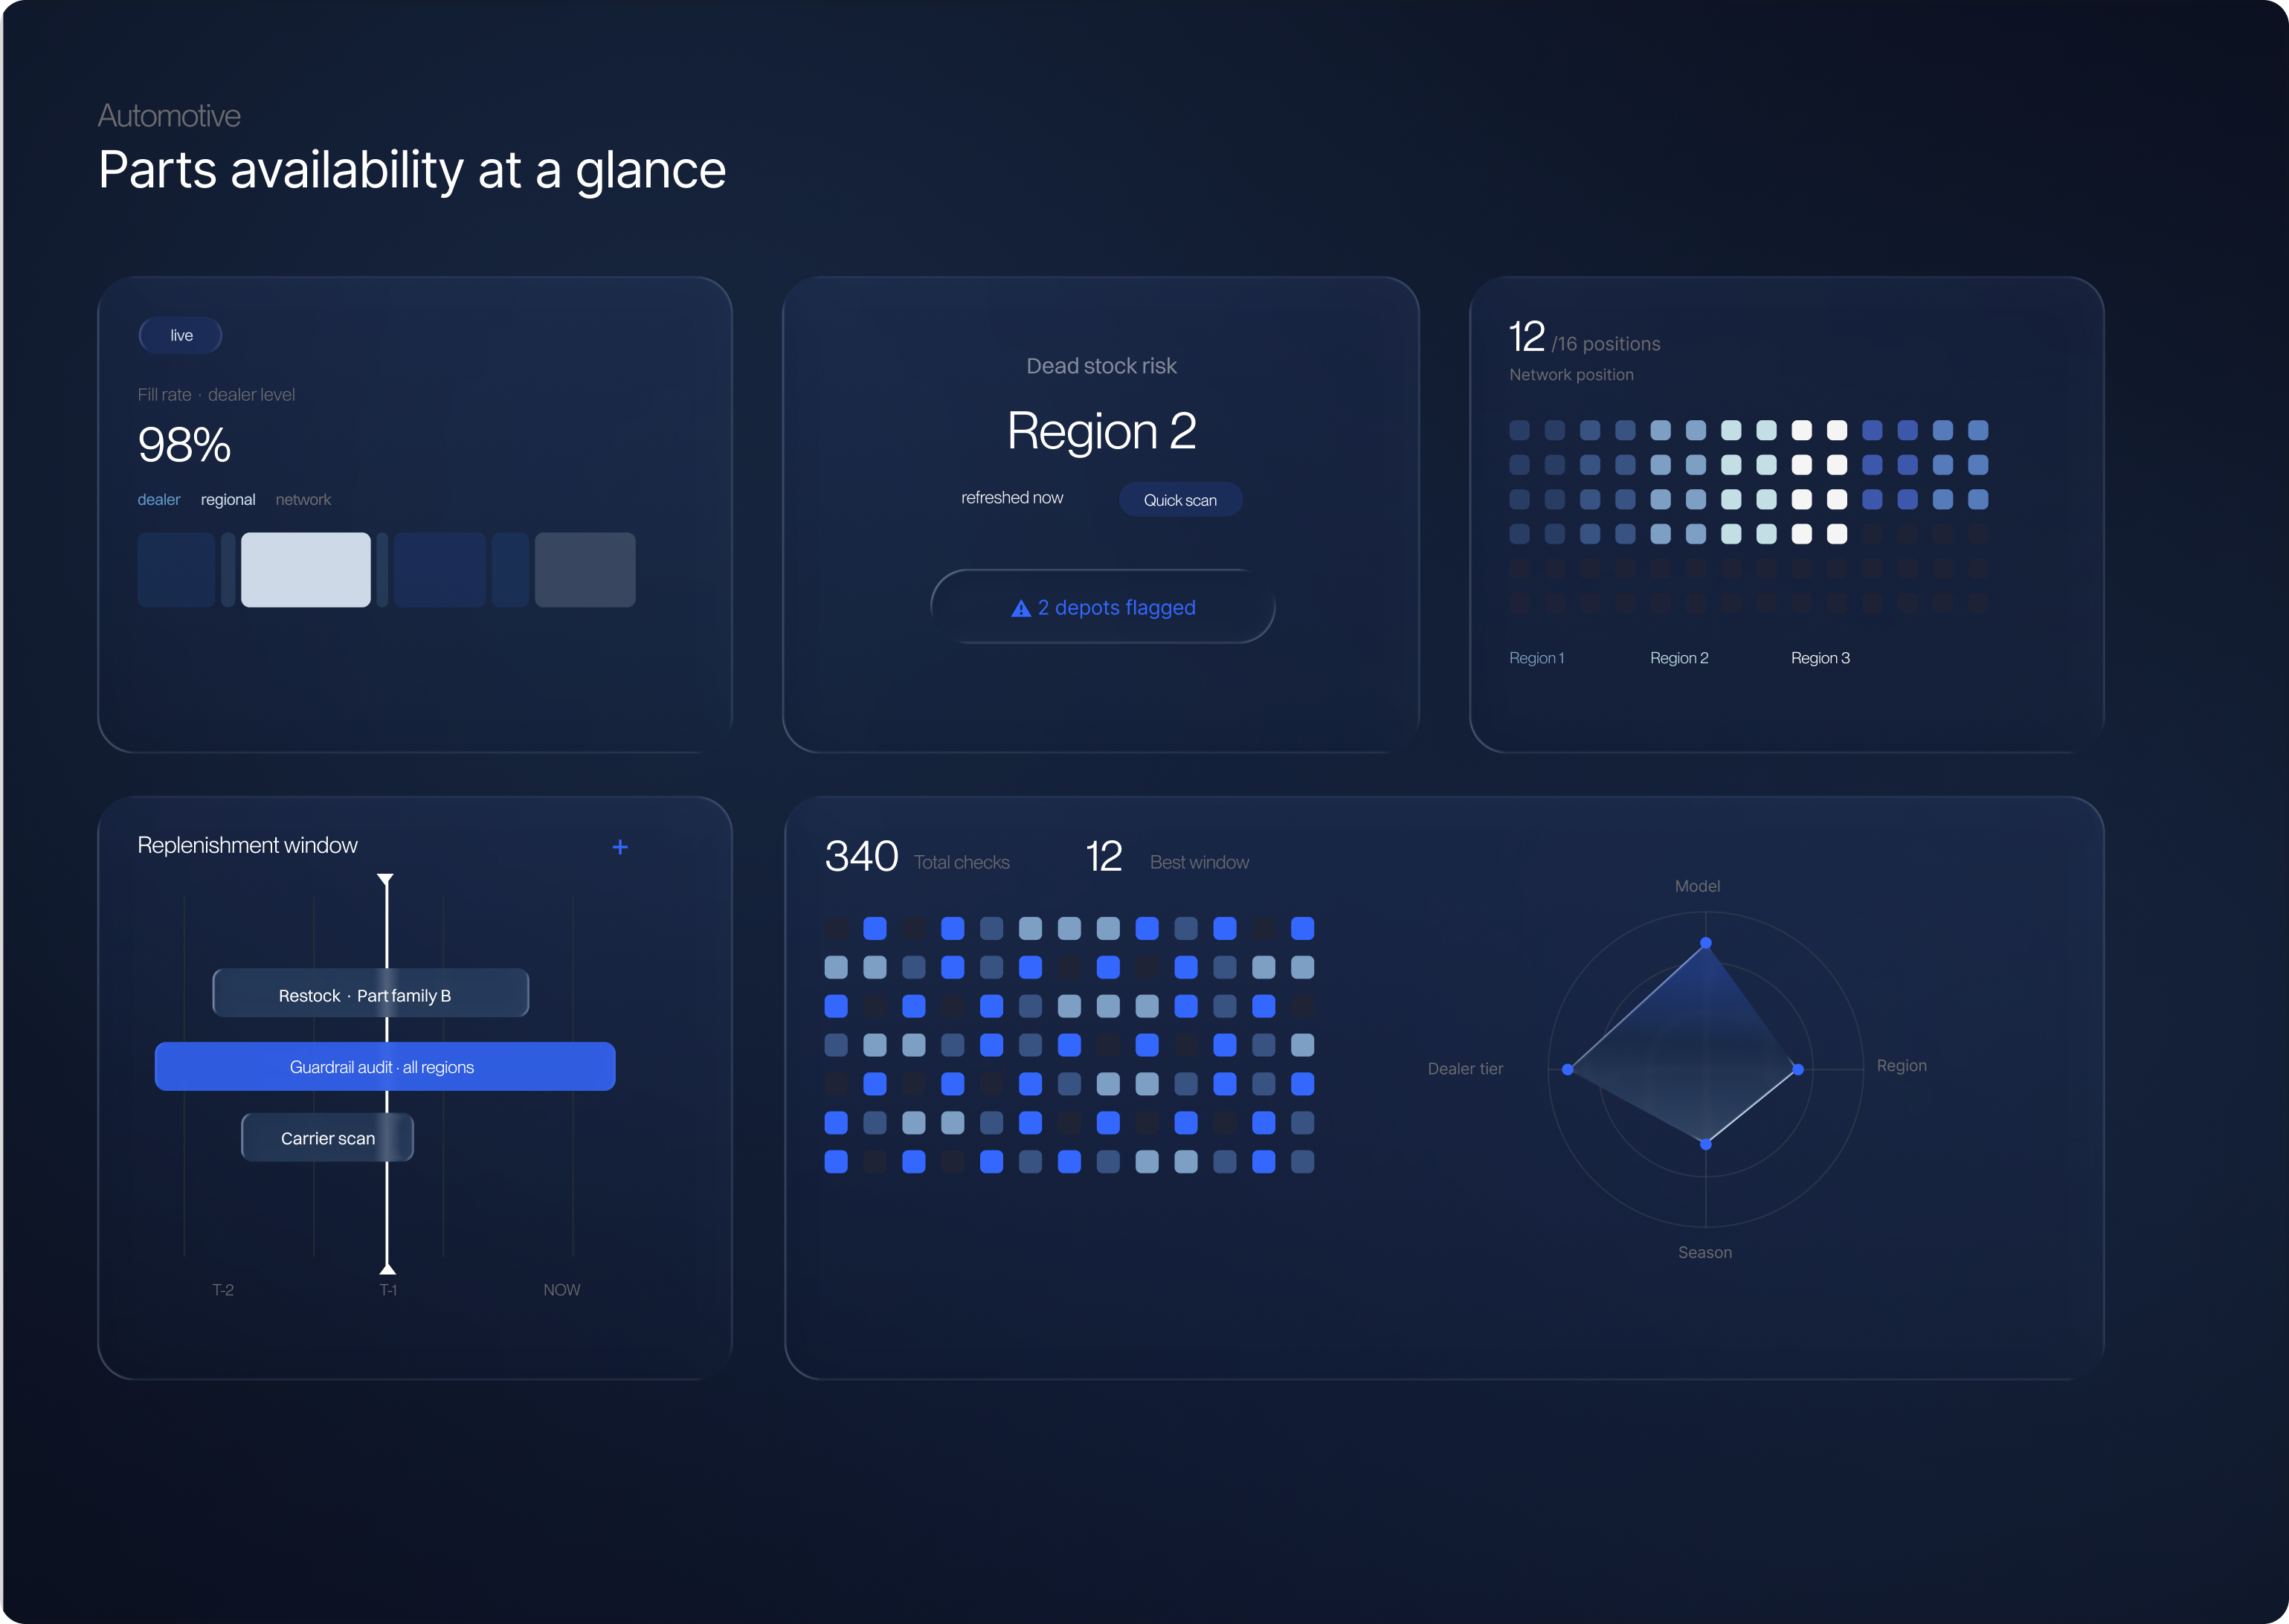
What vdd.ai Builds for Automotive
Parts and service availability optimization: align parts inventory to demand at dealer and regional level, lift fill rates, cut dead stock and emergency shipping costs.
Demand-to-inventory intelligence: forecasting by model, region, season, and dealer tier so the right parts are in the right network position.
Distribution routing: carrier and fleet optimization for parts distribution, built on live constraints, not planned assumptions.
Executive semantic layer: a single governed truth across dealer, OEM, finance, service,and parts data powering KPI reporting that leadership can trust
Hospitality
Hospitality runs on perishable inventory, volatile demand, and multi-property complexity. A room unsold tonight is gone forever, F&B purchasing over-ordered last week is margin written off this week, and across a portfolio of properties, leadership is working from inconsistent KPIs, property-level spreadsheets, and operational data that doesn't reconcile cleanly.


What vdd.ai Builds for Hospitality
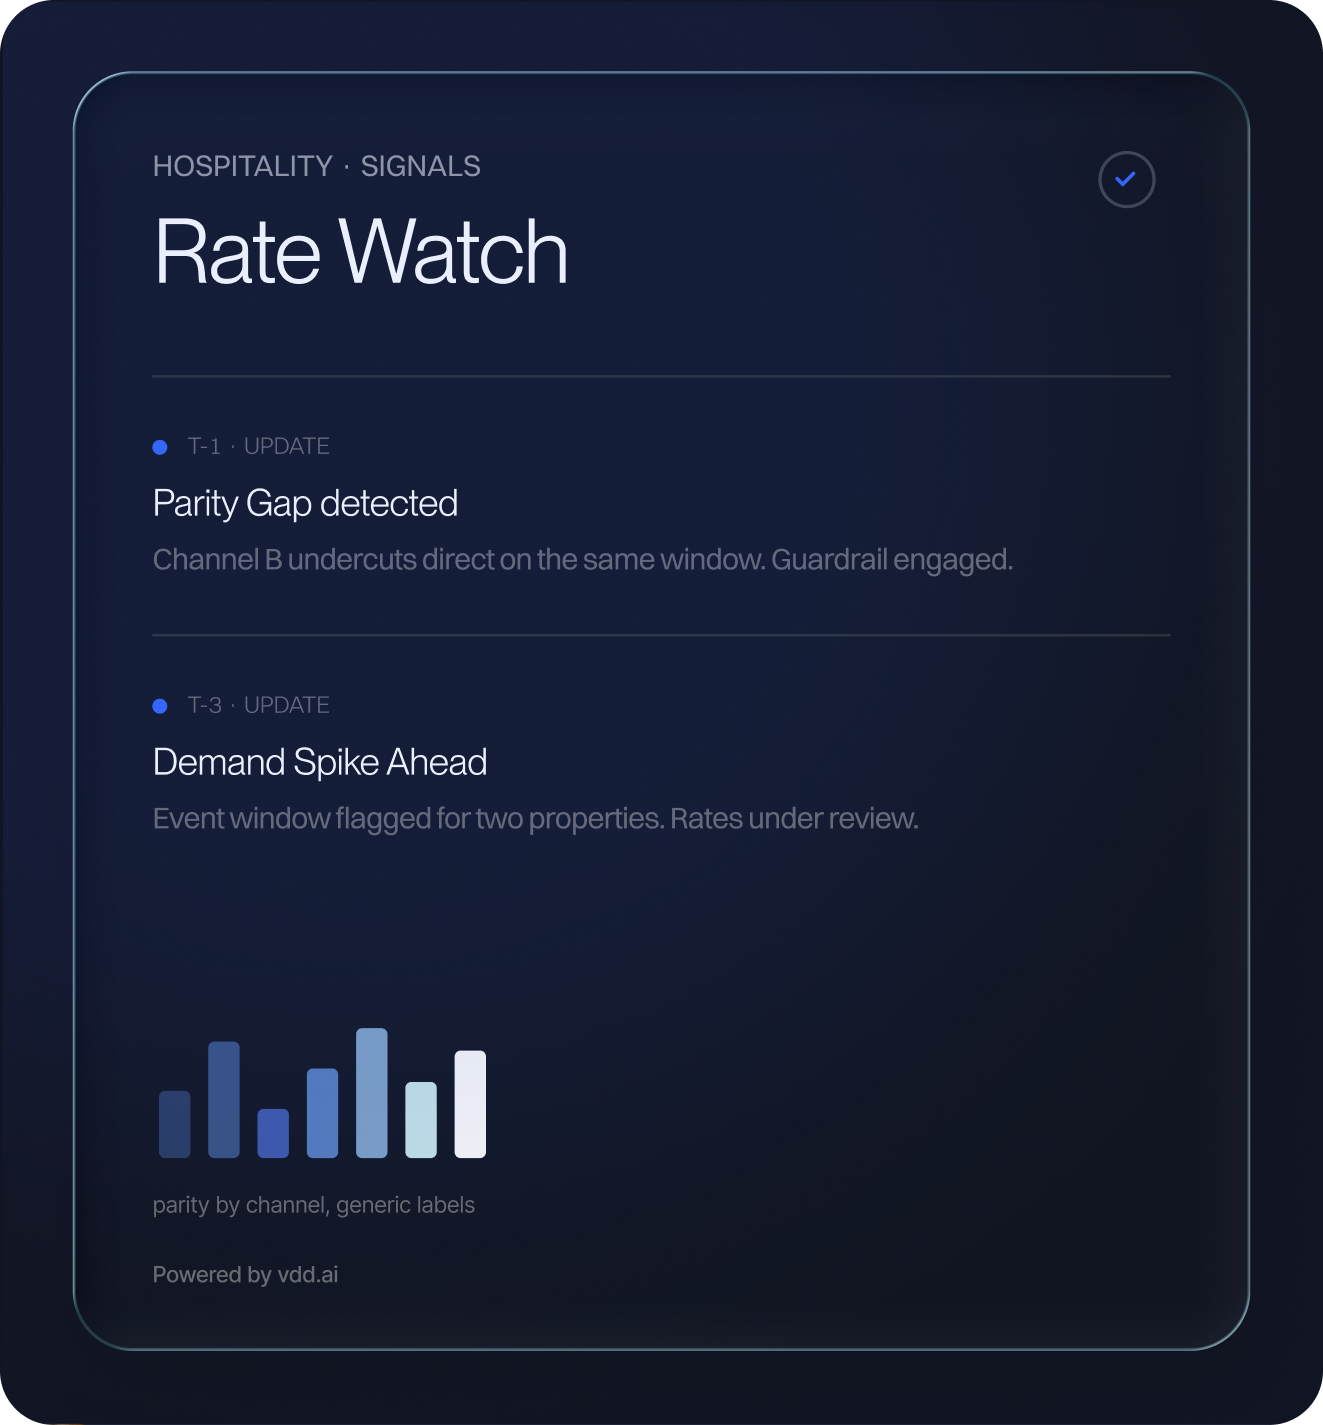
Demand-aware rate optimization: AI agent that monitors demand signals, occupancy forecasts, competitor rate moves, and event calendars to surface rate decisions with configurable guardrails—not just a revenue management tool, but a decision system.
F&B and consumables replenishment: SKU-level purchasing intelligence for food, beverage, amenities, and consumables, resulting in reduced waste, improved availability, and aligned purchasing to actual demand.
Cross-property executive control: a unified semantic layer across all properties, systems, and geographies, giving leadership consistent KPIs, governance, and the ability to compare performance across the portfolio.
Finance
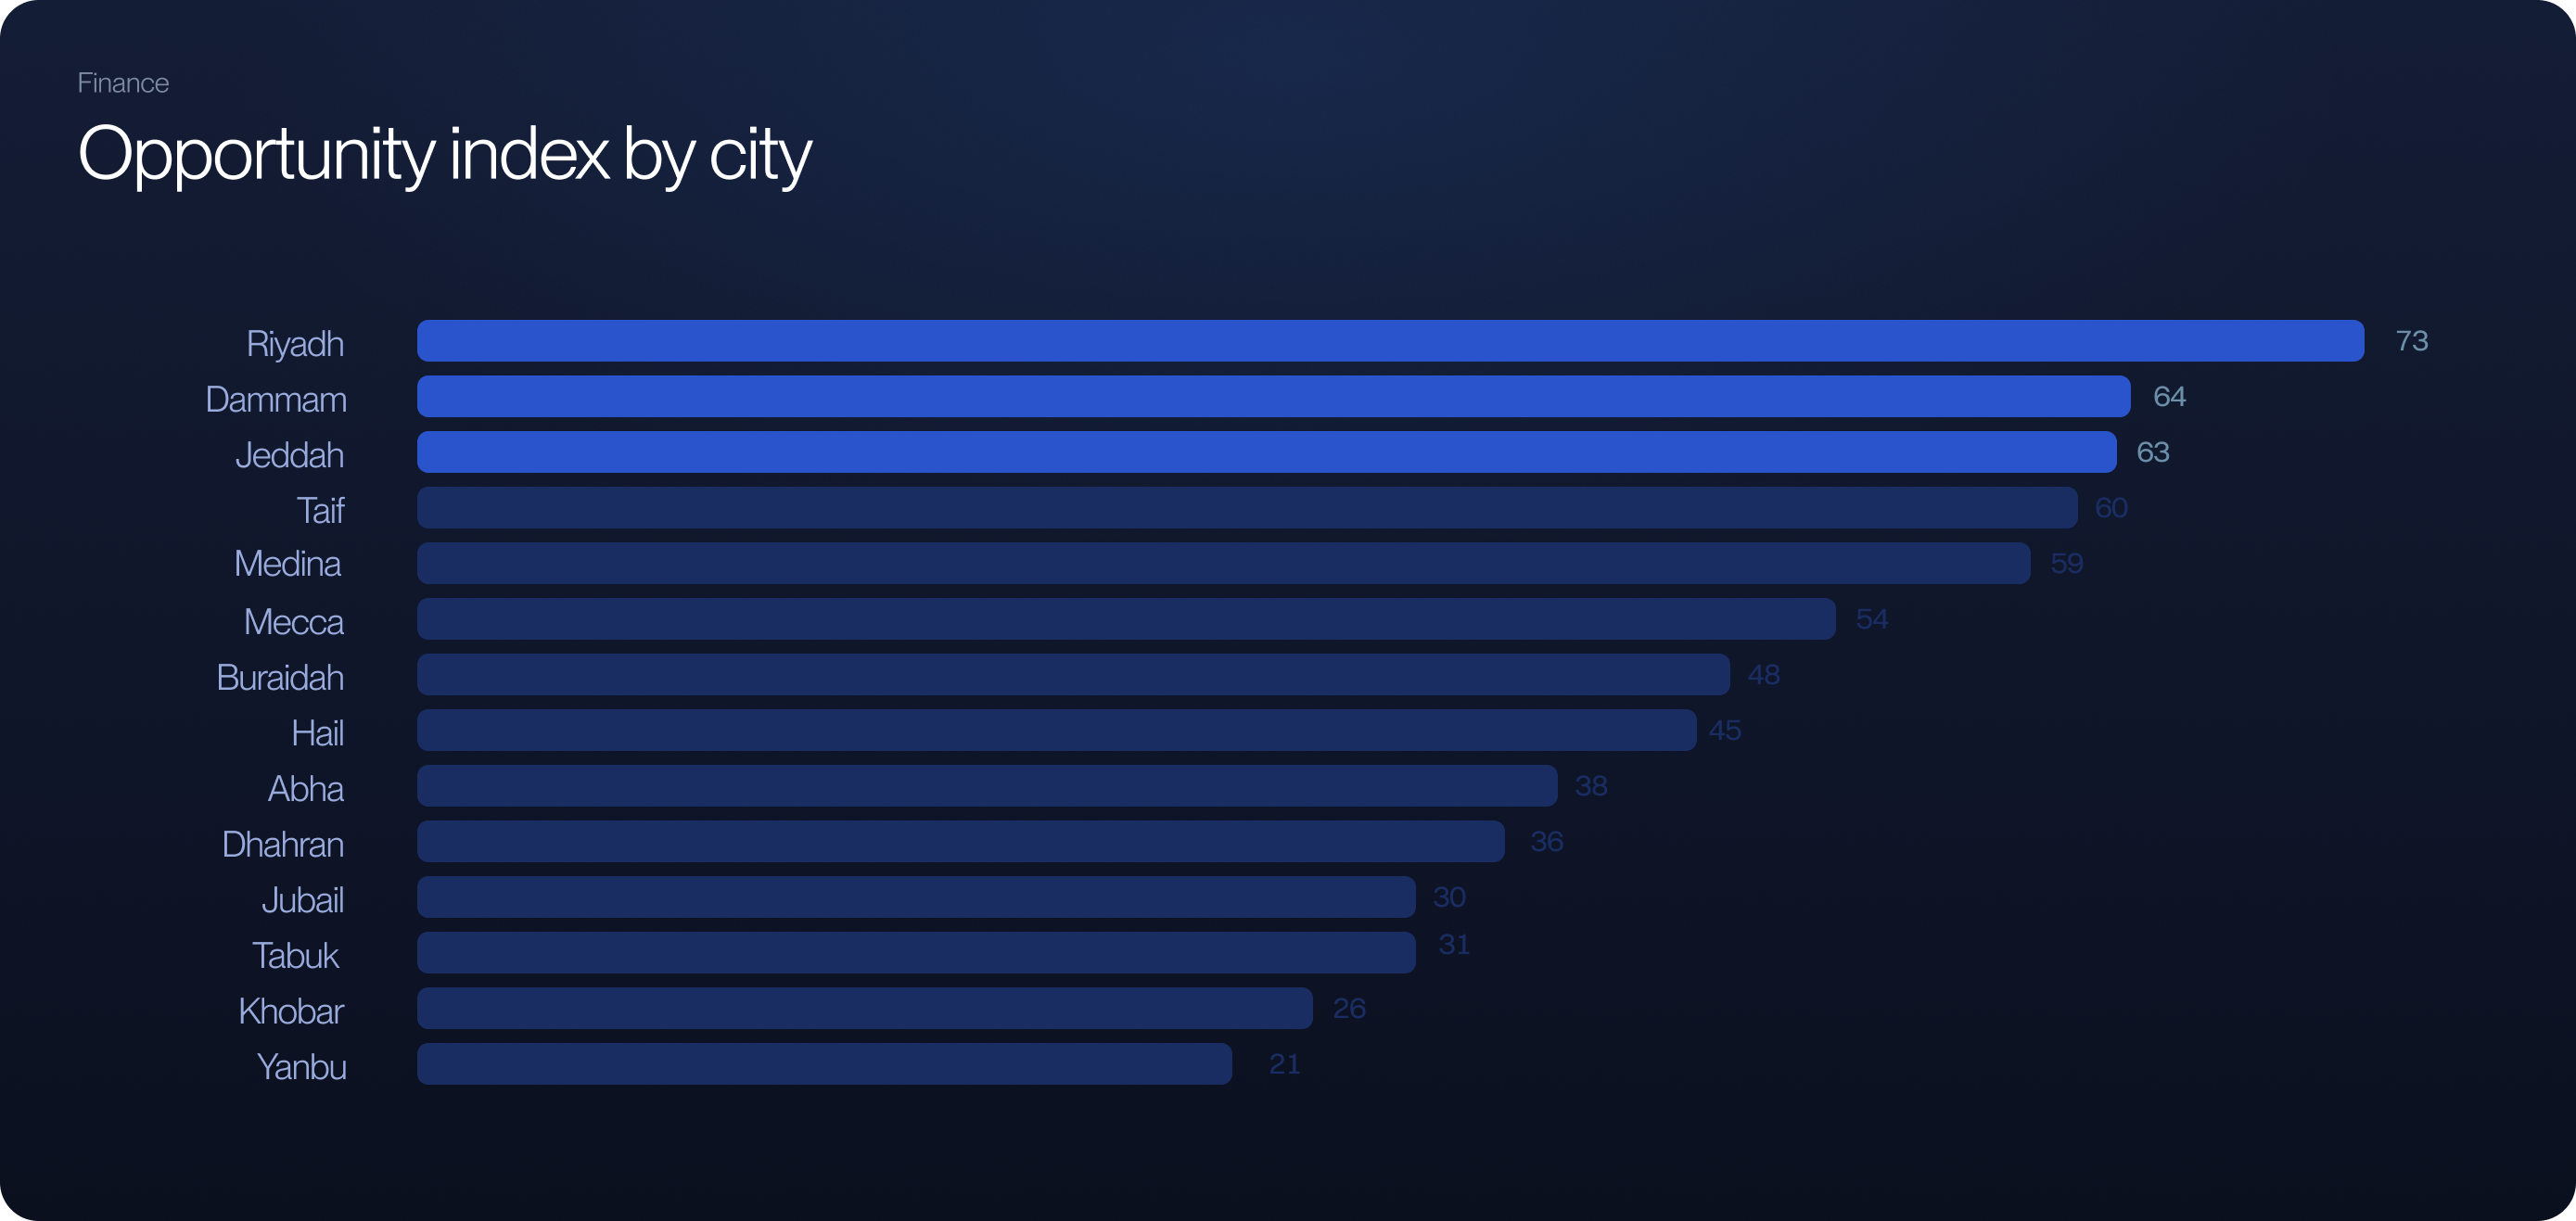
Finance needs two things that are rarely delivered together: governed, auditable internal analytics, and live external signal intelligence. Internal analytics are often fragmented across finance, risk, trading, and operations with inconsistent definitions, poor lineage, and a reporting cadence that lags the decisions it's supposed to support. External signals like M&A activity, narrative shifts, relationship networks, regulatory developments are tracked manually and incompletely.


What vdd.ai Builds for Finance
Audit-ready semantic layer: a governed data foundation across finance, risk, and operations with consistent definitions, full lineage, RBAC-aligned access, and executive reporting built for audit readiness
Deep Social Graph intelligence: map influence networks, relationship histories, and narrative trajectories across people, companies, and topics powering M&A due diligence, deal sourcing, investment research, and narrative risk management
Data governance by design: RBAC, lineage tracking, access segregation, and policy-based controls from day one and not retrofitted after delivery

Telco
Telco is systems-heavy: billing, CRM, network, retail, field ops, and BSS/OSS stacks are often siloed, often legacy, and often the product of multiple acquisitions with their own data architectures. The executive view is assembled from exports, field ops data is disconnected from inventory, and AI initiatives stall because the data foundation isn't ready to support them.


What vdd.ai Builds for Telco
Unified truth across billing, CRM, network, retail, and field ops
Inventory and field ops optimization: parts and equipment availability intelligence aligned to field scheduling, predictive maintenance signals, and network deployment plans.
Executive layer built for scale: governance, lineage, and speed
Real Estate
Real estate data is fragmented by design: property management systems, lease management, capex tracking, tenant CRM, valuation models, and external market signals all live in different places. Portfolio companies operate across geographies with inconsistent KPI definitions. And the early-warning signals that matter most, like tenant risk, market narrative shifts, and local demand dynamics, are either not tracked or tracked manually.


What vdd.ai Builds for Real Estate
Single semantic layer across leases, tenants, capex, operations, and valuation inputs
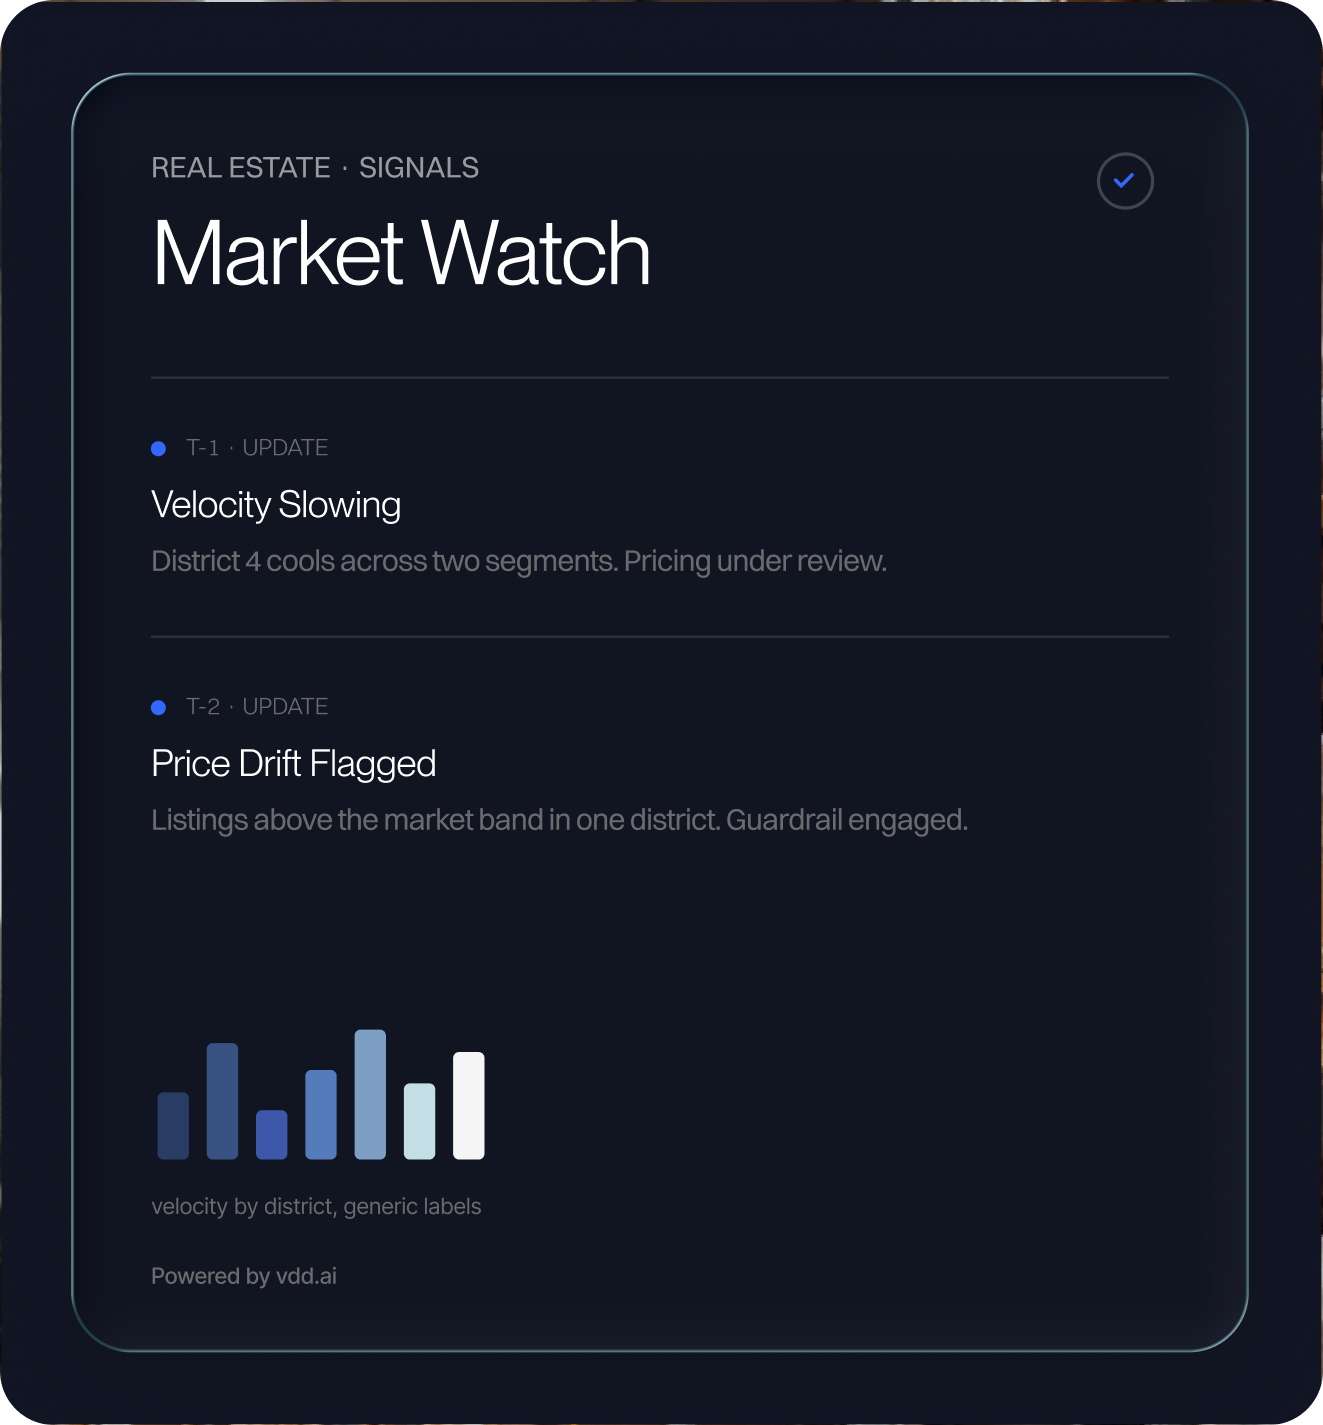
Early-warning signal system: tenant risk indicators, market narrative shifts, localdemand and regulatory dynamics surfaced from the open web and mapped toportfolio assets
Board-ready performance control: KPI consistency across portfolios and geographies, with lineage and audit trail for investor reporting
Logistics & Supply Chain
Logistics is where constraints collide- SLAs, carrier capacity, hub throughput, last-milevariability, cost-to-serve pressure, and continuous disruption from weather, demand spikes, and network changes. Most routing systems optimize a plan, but the plan is obsolete the moment reality deviates. And cost-to-serve visibility across the full network is often absent, making it impossible to know where margin is being destroyed.


What vdd.ai Builds for Logistics & Supply Chain
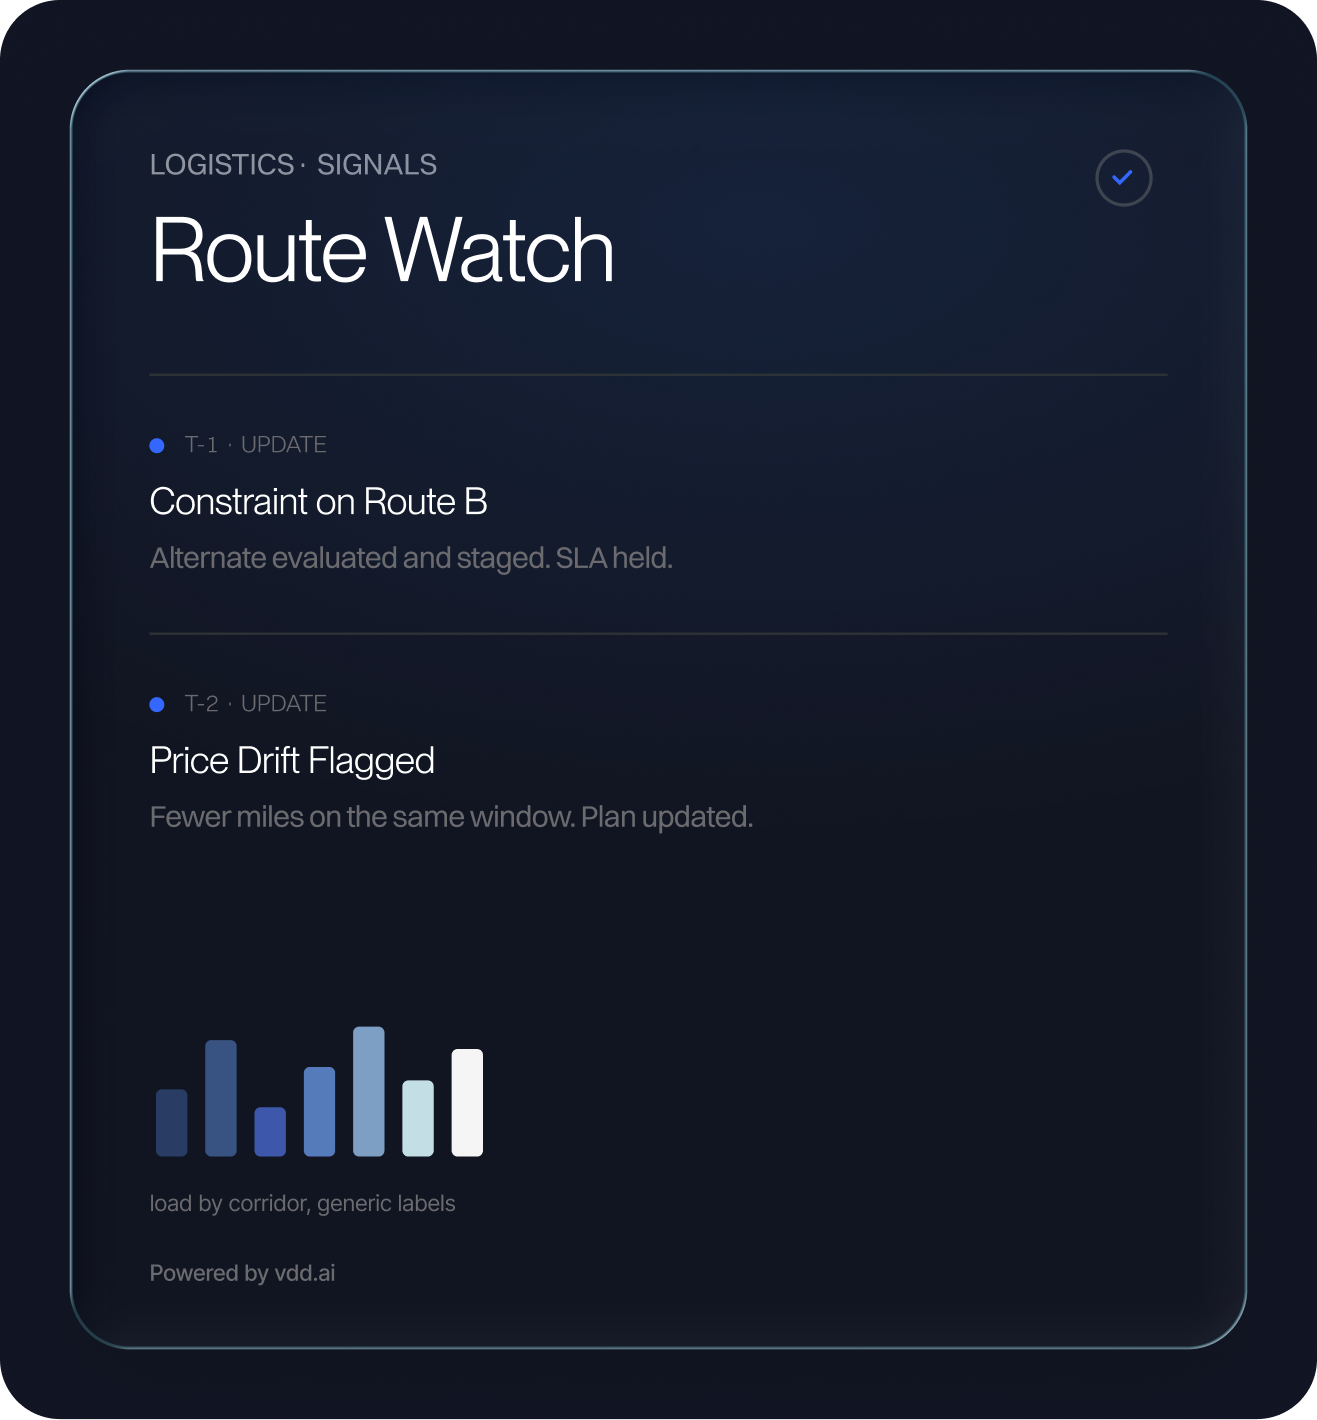
Dynamic route optimization under live constraints: real-time geospatial and predictive intelligence that recomputes routing as traffic, capacity, and service window conditionschange• Cost-to-se
Cost-to-serve intelligence: full network visibility covering miles, load factors, carrier performance, and delivery cost by lane, region, and customer segment.
Network-level optimization: hub-to-hub flows, last-mile allocation, carrier mix optimization, and SLA performance monitoring.
Fulfillment inventory coupling: optionally link stock positioning to routing intelligence so inventory availability and delivery capability are optimized together.
Luxury
Luxury is often misconstrued as 'maximize revenue at any cost.' But it’s more than that - it is control: scarcity, brand equity, client segmentation, and carefully governed discounting. The wrong promo at the wrong time erodes years of brand positioning. Assortment decisions in the wrong store dilute the exclusivity that justifies price. And yet, luxury brands face the same operational complexity as any retailer in the market - fragmented systems, siloed CRM and merchandising data, and pricing decisions made without real-time competitive context.


What vdd.ai Builds for Luxury
Assortment precision: AI-driven product allocation by store, city, and client segment, ensuring the right product reaches the right client without diluting scarcity
Brand-safe pricing intelligence: competitive monitoring calibrated to luxury comps, not mass-market benchmarks
Executive semantic layer: a unified view across retail, CRM, and merchandising that leadership can use for both reporting and strategic decisions
Controlled discount and promo governance: policy-enforced guardrails that prevent brand erosion while still surfacing legitimate promotional opportunities by segment, location, and client tier